
HEALTH & LONGEVITY APP
The Health & Longevity App was designed to give users a comprehensive, real-time physiological picture of their current health state — transforming raw biometric data into meaningful insight and situational awareness. The goal was to empower users to make informed lifestyle decisions that directly influence their long-term health and longevity.
PROJECT OVERVIEW:
Product: Health & Longevity App
Domain: Digital Health
Role: UX Designer & Reseracher
Users: Health and Wellness
Platforms: iOS mobile app, Wearable device
Focus: Delivering a frictionless bridge between wearable and platform
Tools: FIGMA, Confluence, JIRA, Maze
My Role:
UX research and journey mapping
Interaction design and system state modelling
Wireframing and high-fidelity UX design
Collaboration with engineers on BLE constraints and background syncing logic
Iterative usability testing and refinement
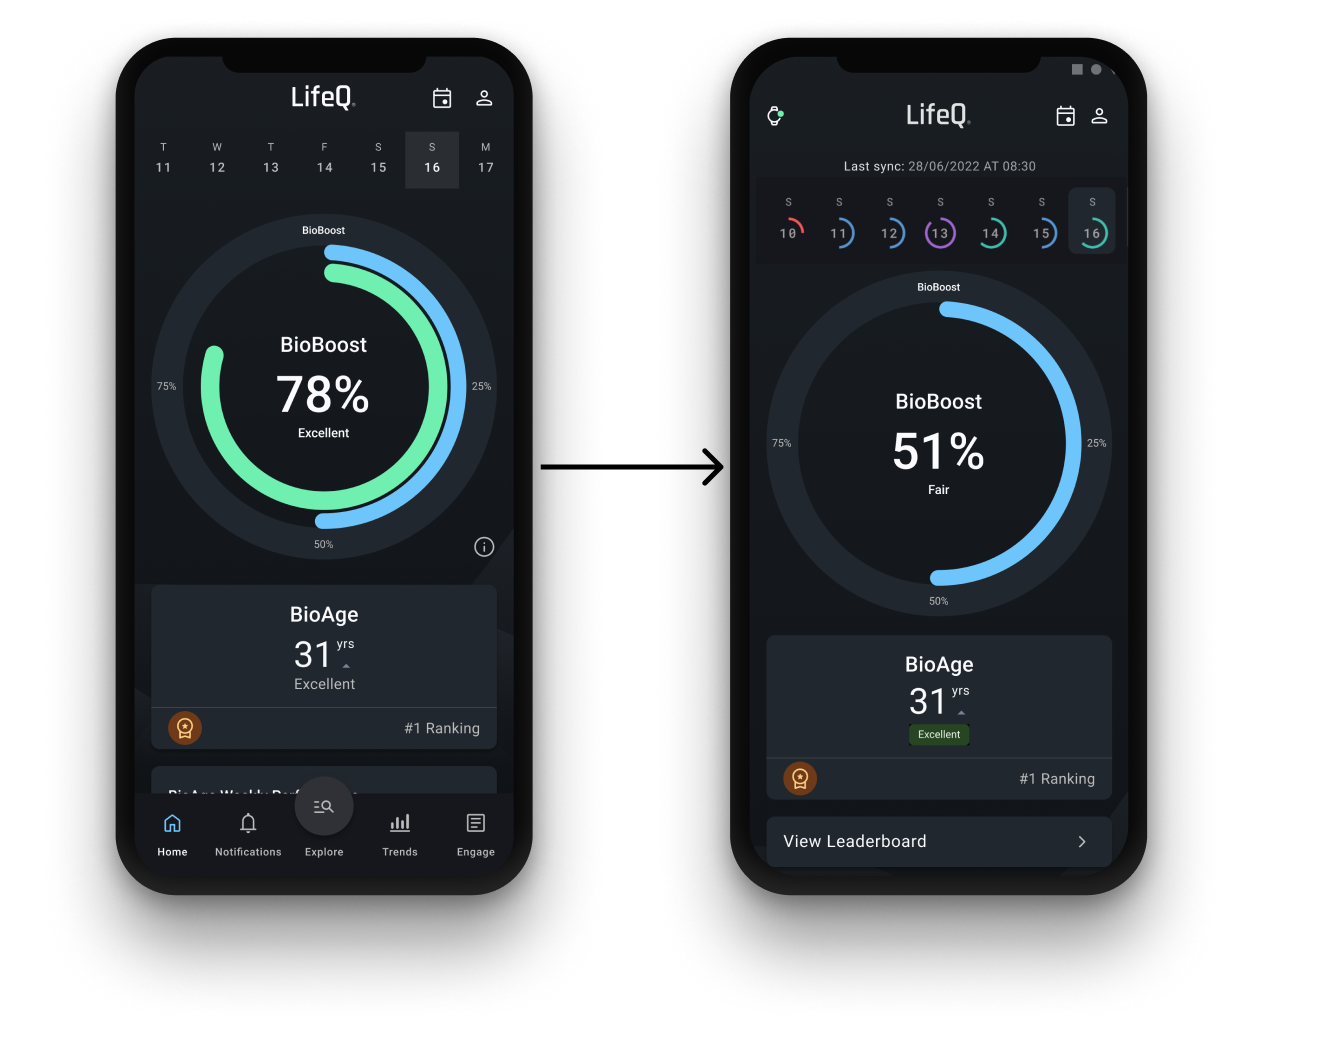
The challenge lay in translating complex physiological data and new concepts — such as BioAge and BioBoost — into an experience that felt intuitive, motivating, and personally relevant. Many users found traditional health metrics abstract or intimidating, so our focus was on building understanding and trust through thoughtful information design, narrative framing, and progressive disclosure.
The design approach centered on three principles:
Clarity: Simplify the interpretation of novel metrics through clear visual hierarchies, context cues, and guided explanations.
Meaning: Frame physiological data within the user’s personal health journey, linking daily habits to long-term outcomes.
Engagement: Foster intrinsic motivation by helping users perceive the value of their data — creating a sense of ownership and reward in tracking progress.
Through iterative prototyping and testing, the app evolved into a visually calm, insight-driven experience that bridges the gap between scientific depth and everyday usability. It not only presents data but helps users understand what it means, why it matters, and how to act on it — making longevity feel actionable, not abstract.
The Problem:
Health tracking tools are often fragmented and reactive…
ONE
Users juggle multiple apps (sleep, fitness, nutrition, mood, etc.)
“How do we design a holistic, 24/7 health companion that helps users make informed, personalized decisions about their health — without overwhelming them?”
TWO
They lack personalization and holistic insight
THREE
Overwhelm from raw data without clear action
FOUR
Little ongoing guidance or adaptability as health evolves
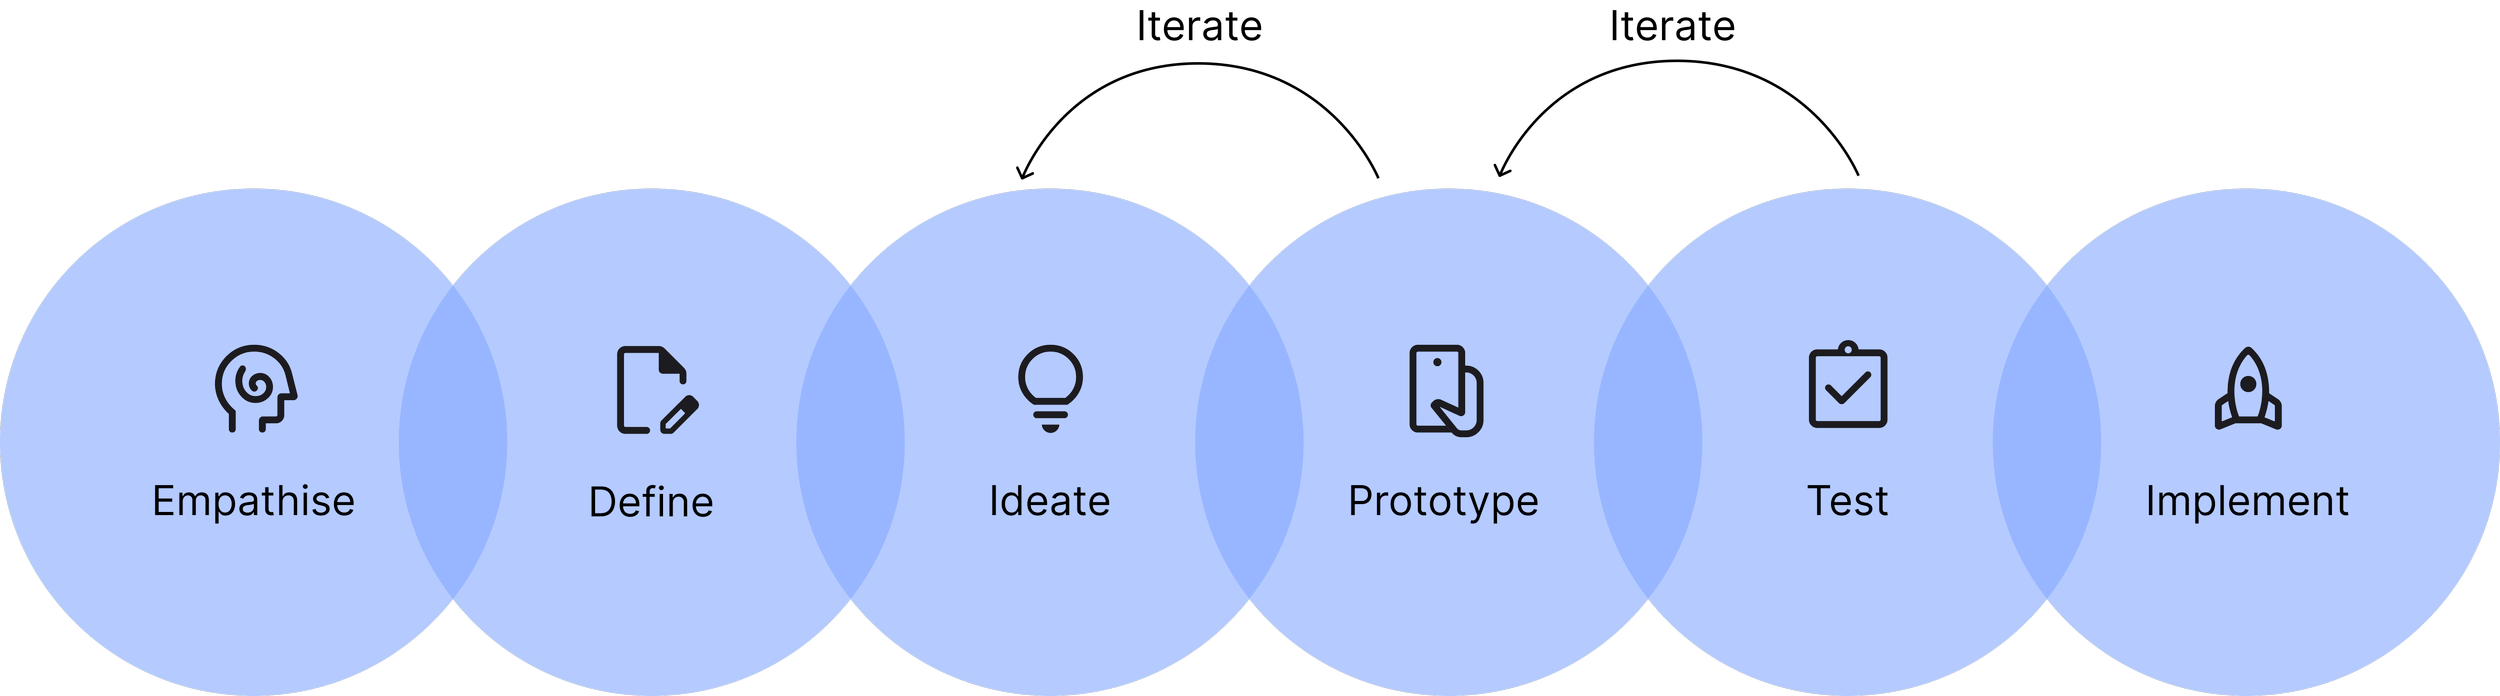
The Design Process
Competitor Analysis
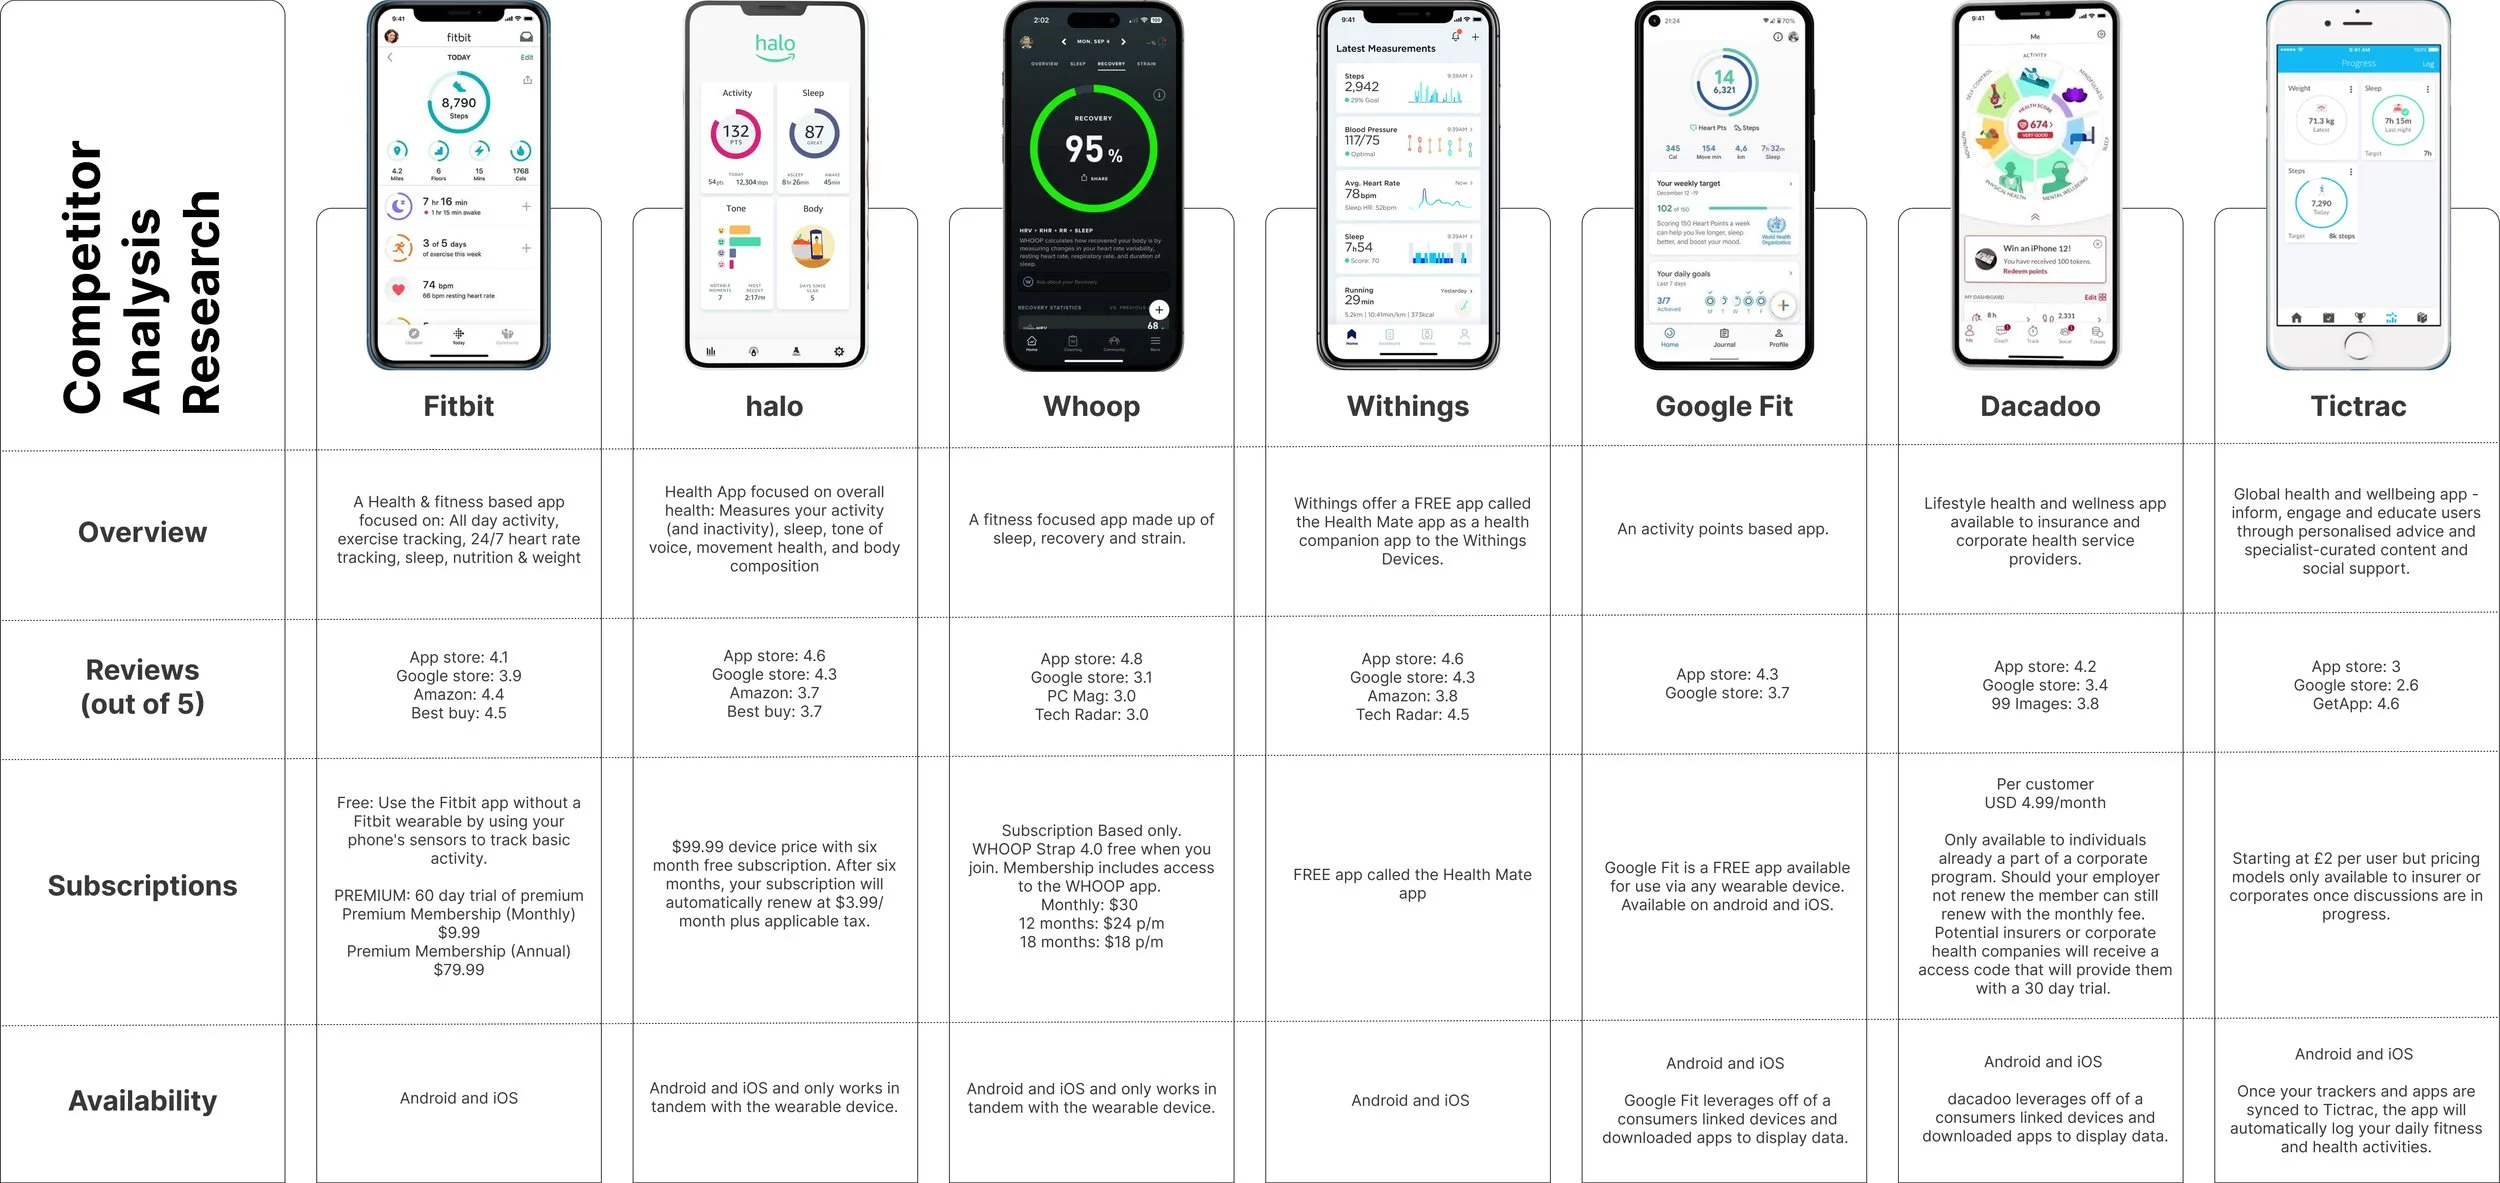
A competitor Analysis on the most prominent competitor apps that rely on wearable data.
To provide a data driven answer to a question that is often encountered: “Why would a person use the LifeQ app if they can get the same information for free elsewhere?”
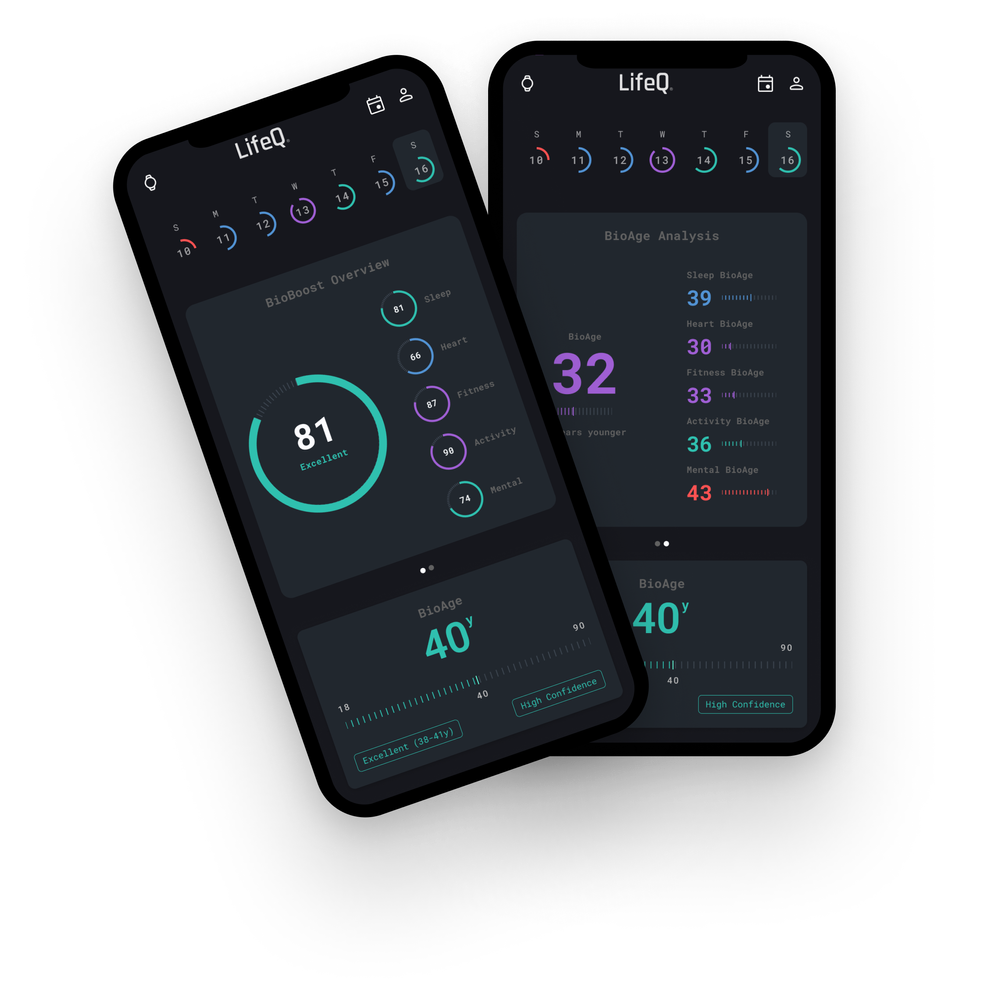
Build BioAges for physiological systems.
Enable continuous monitoring of fitness + longevity markers (device + app )
Translate complex biomarkers into a single, understandable insights and recommendations
Ensure data accuracy and trustworthiness to satisfy users and business stakeholders
Support B2C trust + B2B scalability (research, insurers, health providers)
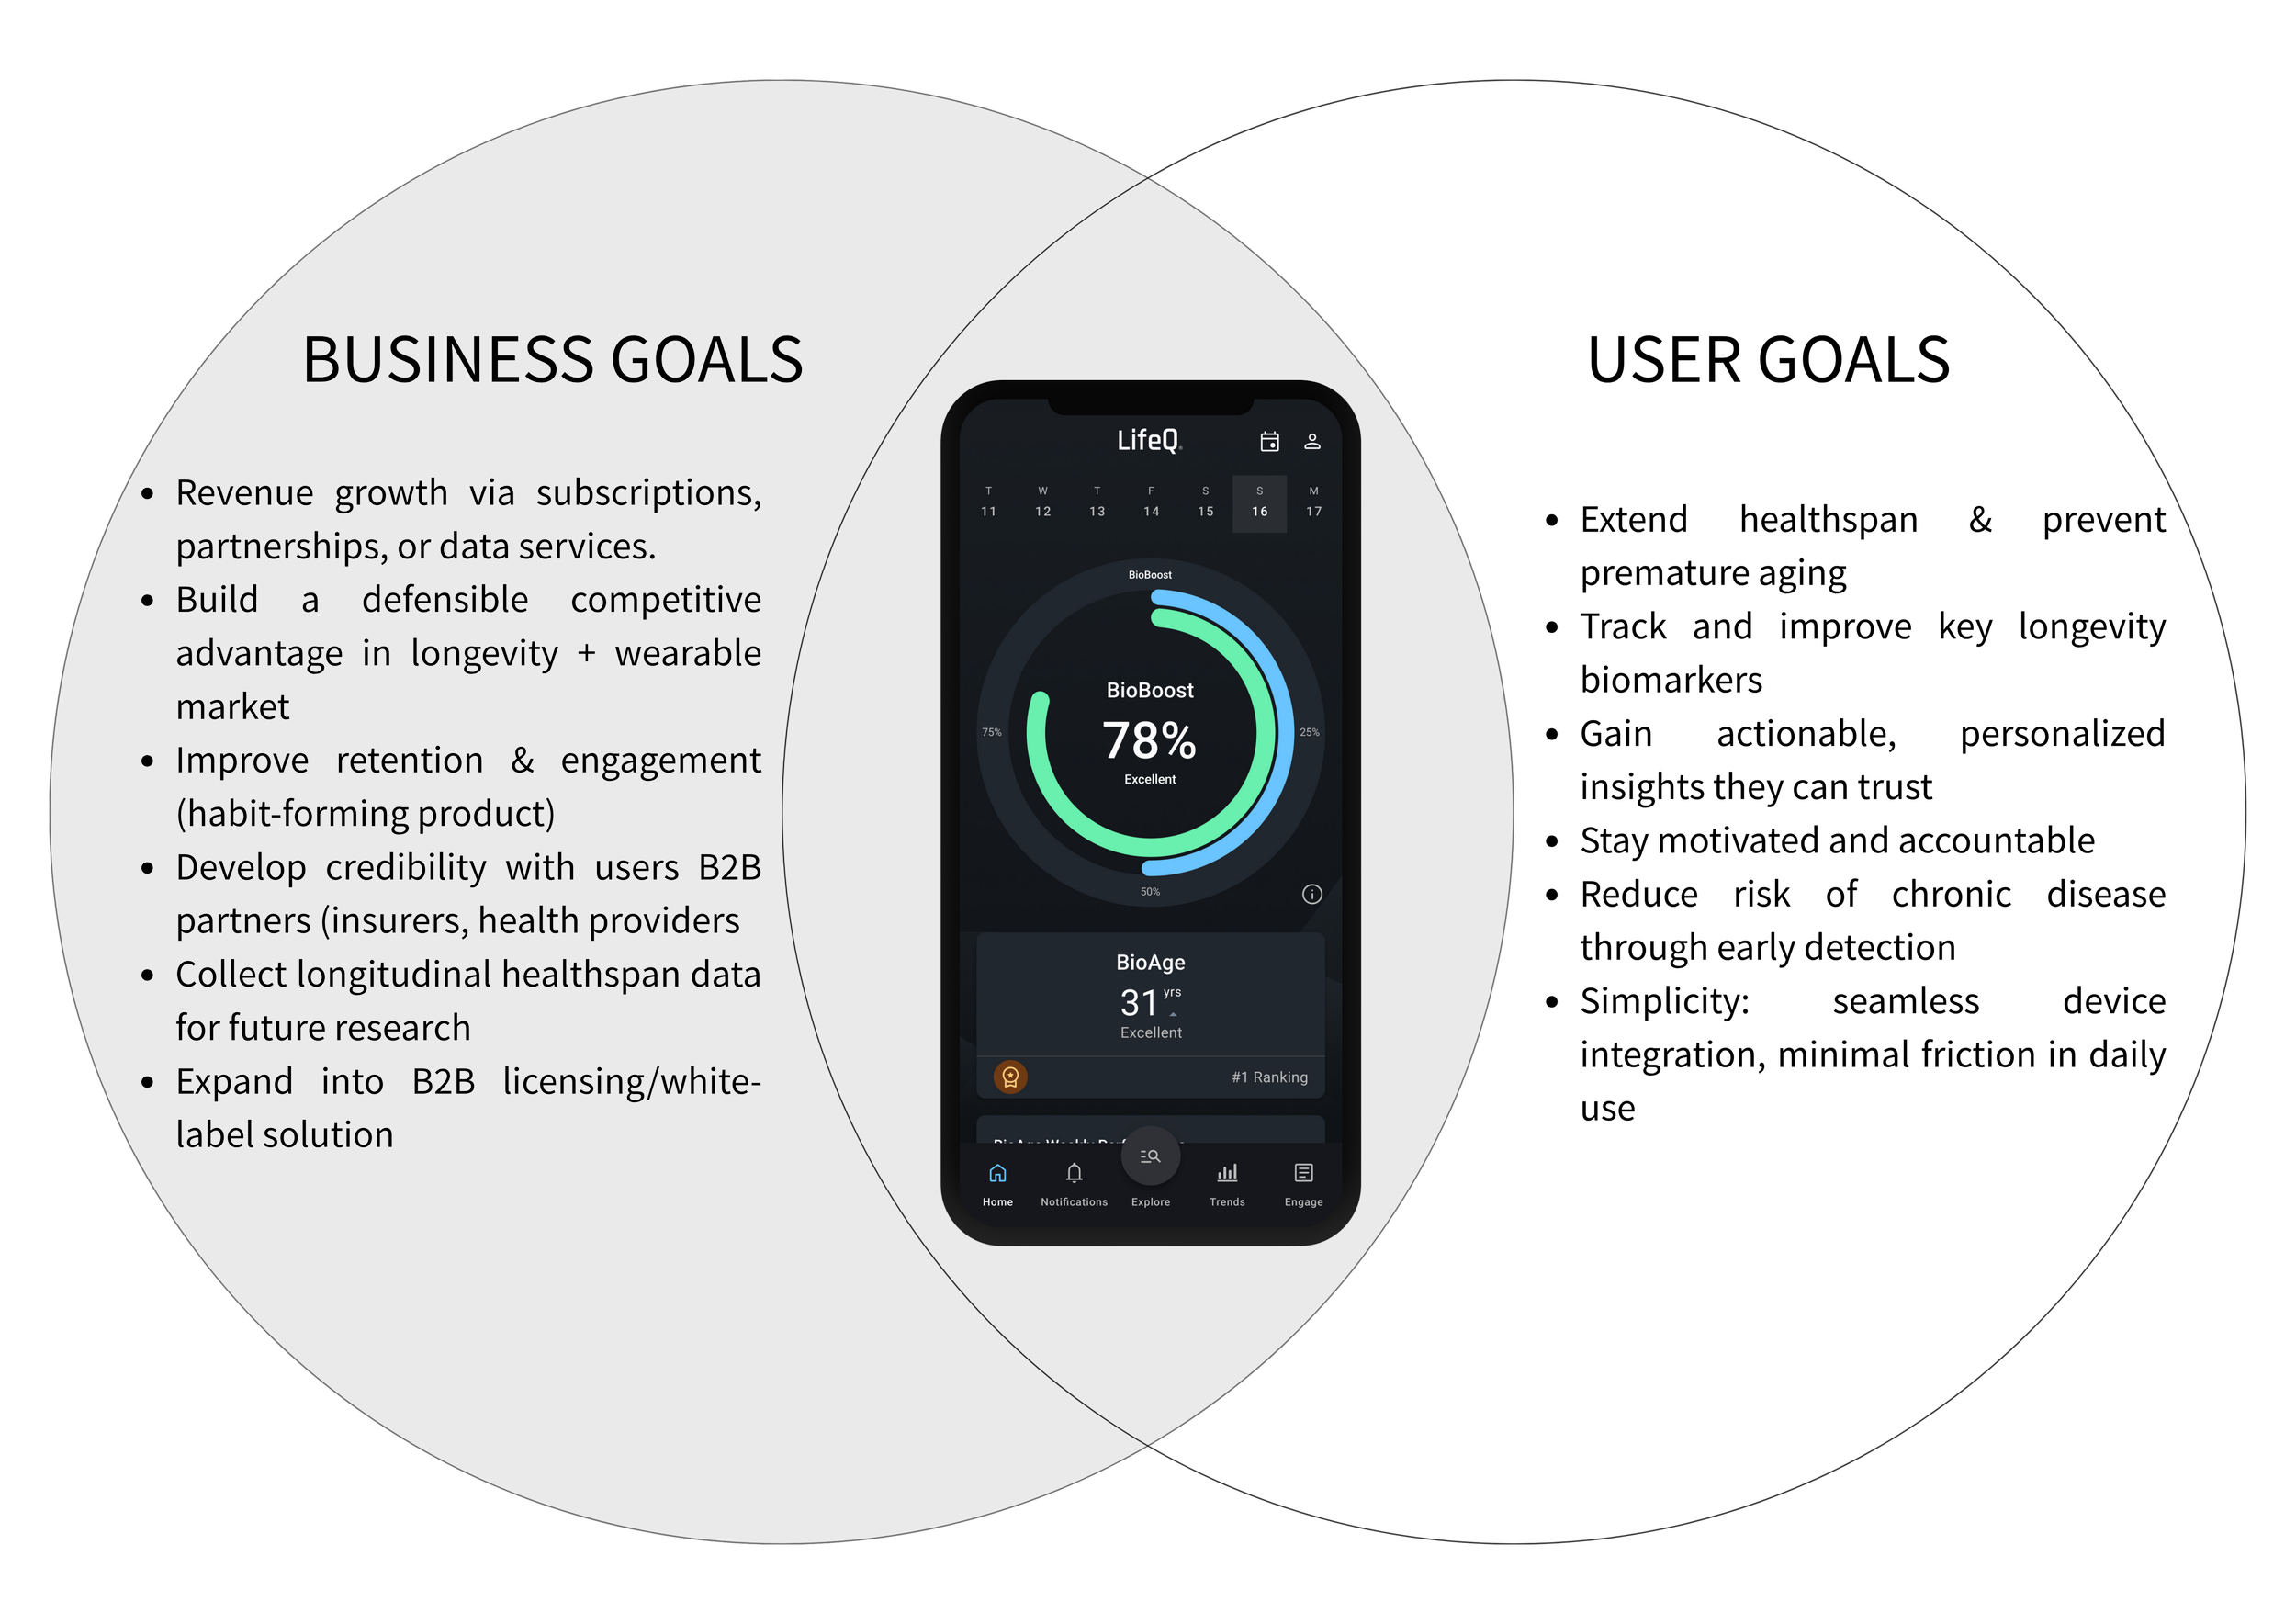
Define The Product
Ideation Process
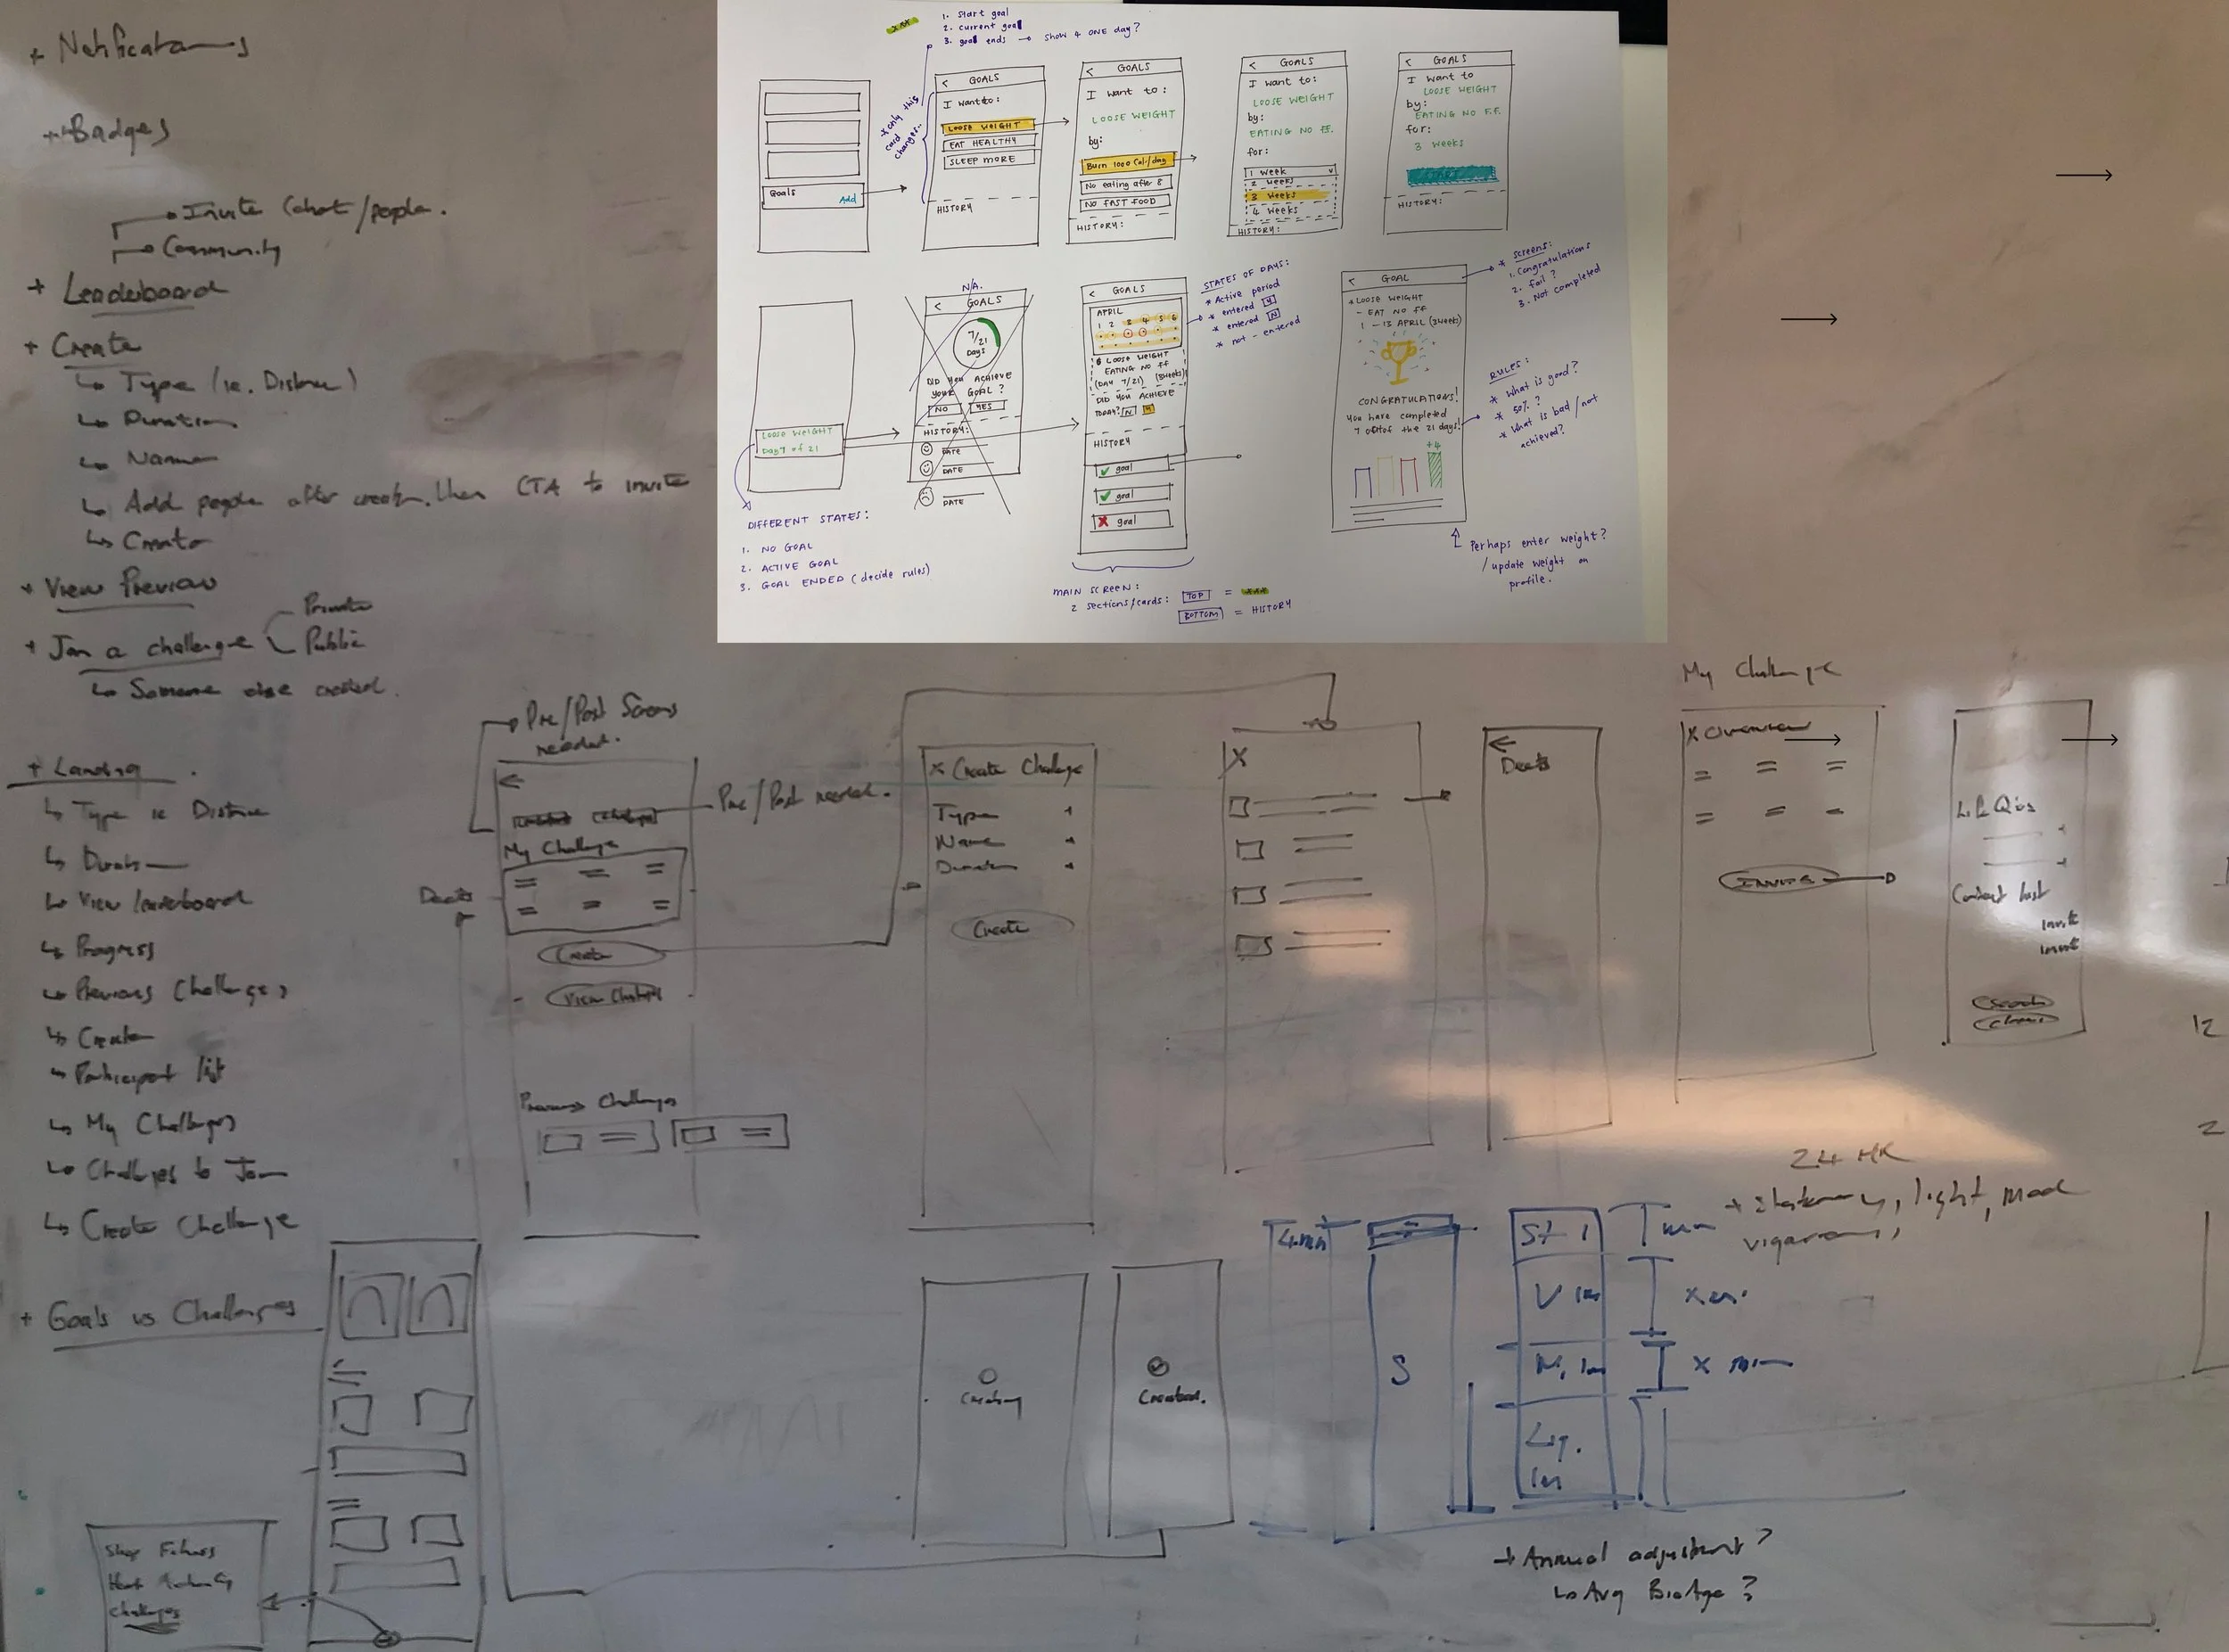
-
Facilitated cross-functional workshops to align on product vision, user needs, and metric prioritisation
Mapped user journeys and decision points to identify moments of cognitive friction
Sketched early interaction models and information hierarchies collaboratively
Challenged assumptions around how users interpret novel health metrics
Defined core experience principles to guide downstream design
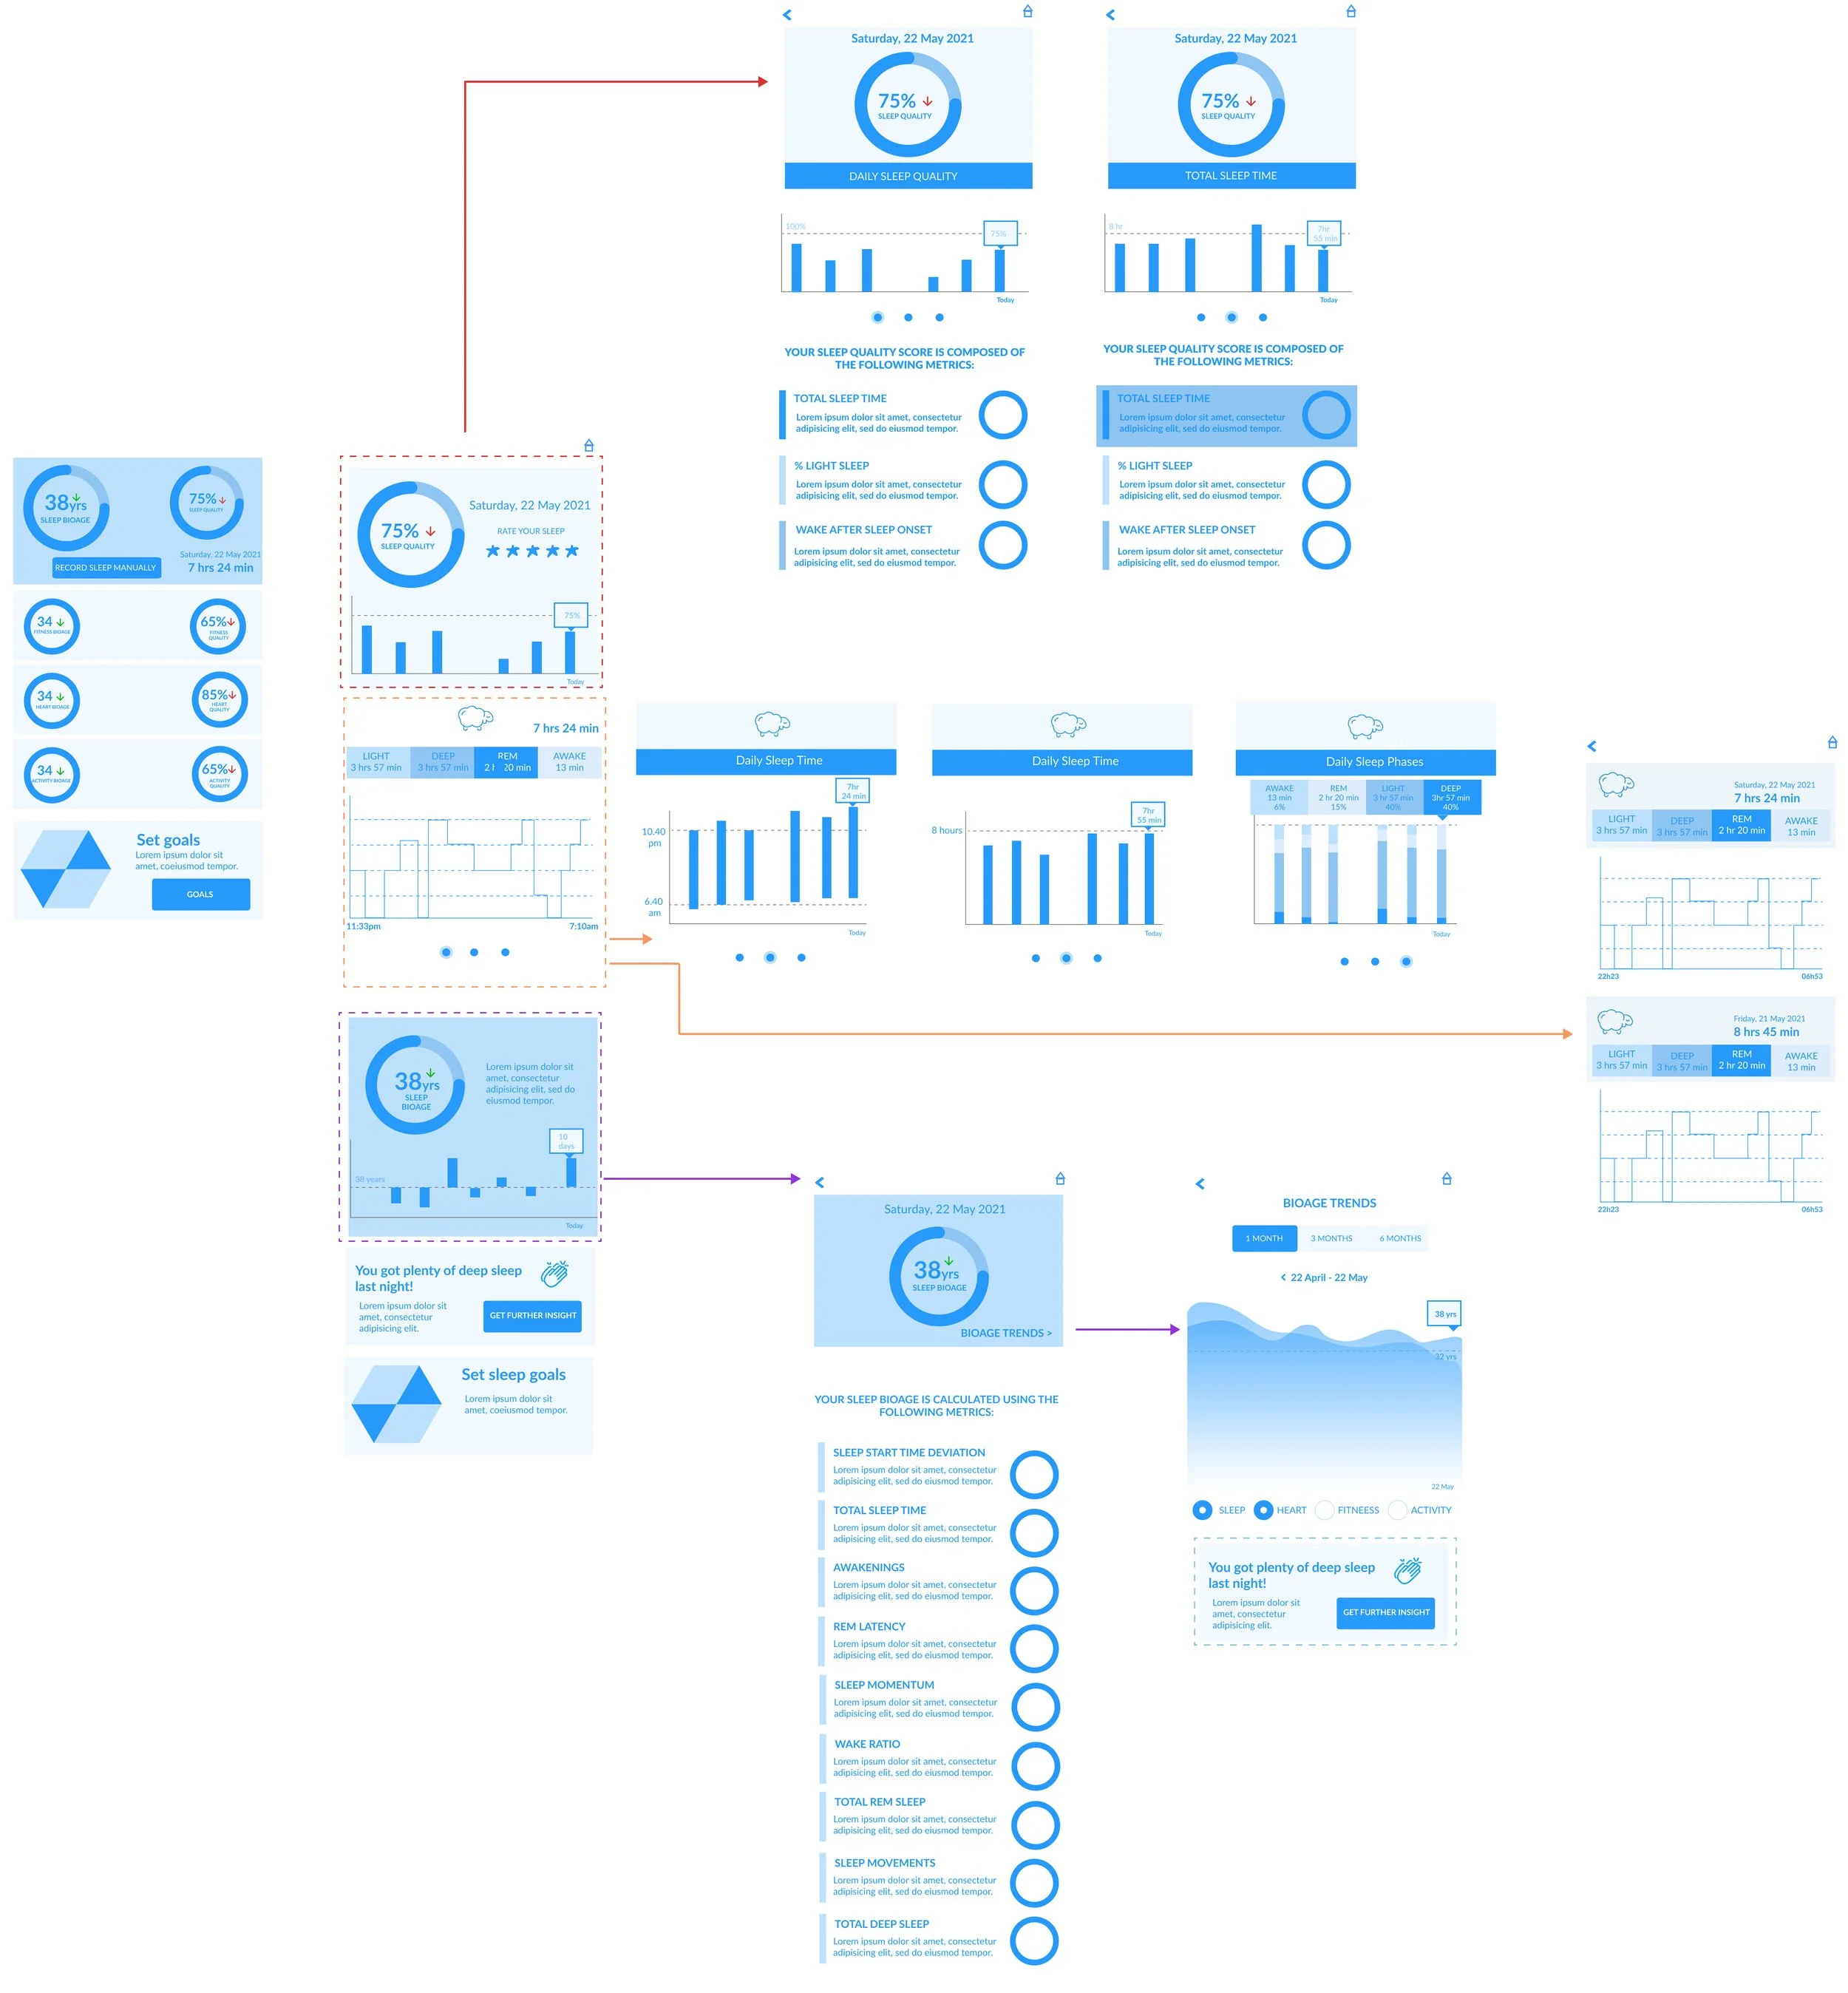
-
Translated workshop outputs into low-fidelity screen flows and interaction patterns
Explored alternative layouts for complex data visualisation components
Tested hierarchy, progressive disclosure, and content density
Iterated rapidly to validate navigation logic and mental model alignment
Reduced complexity before introducing visual styling
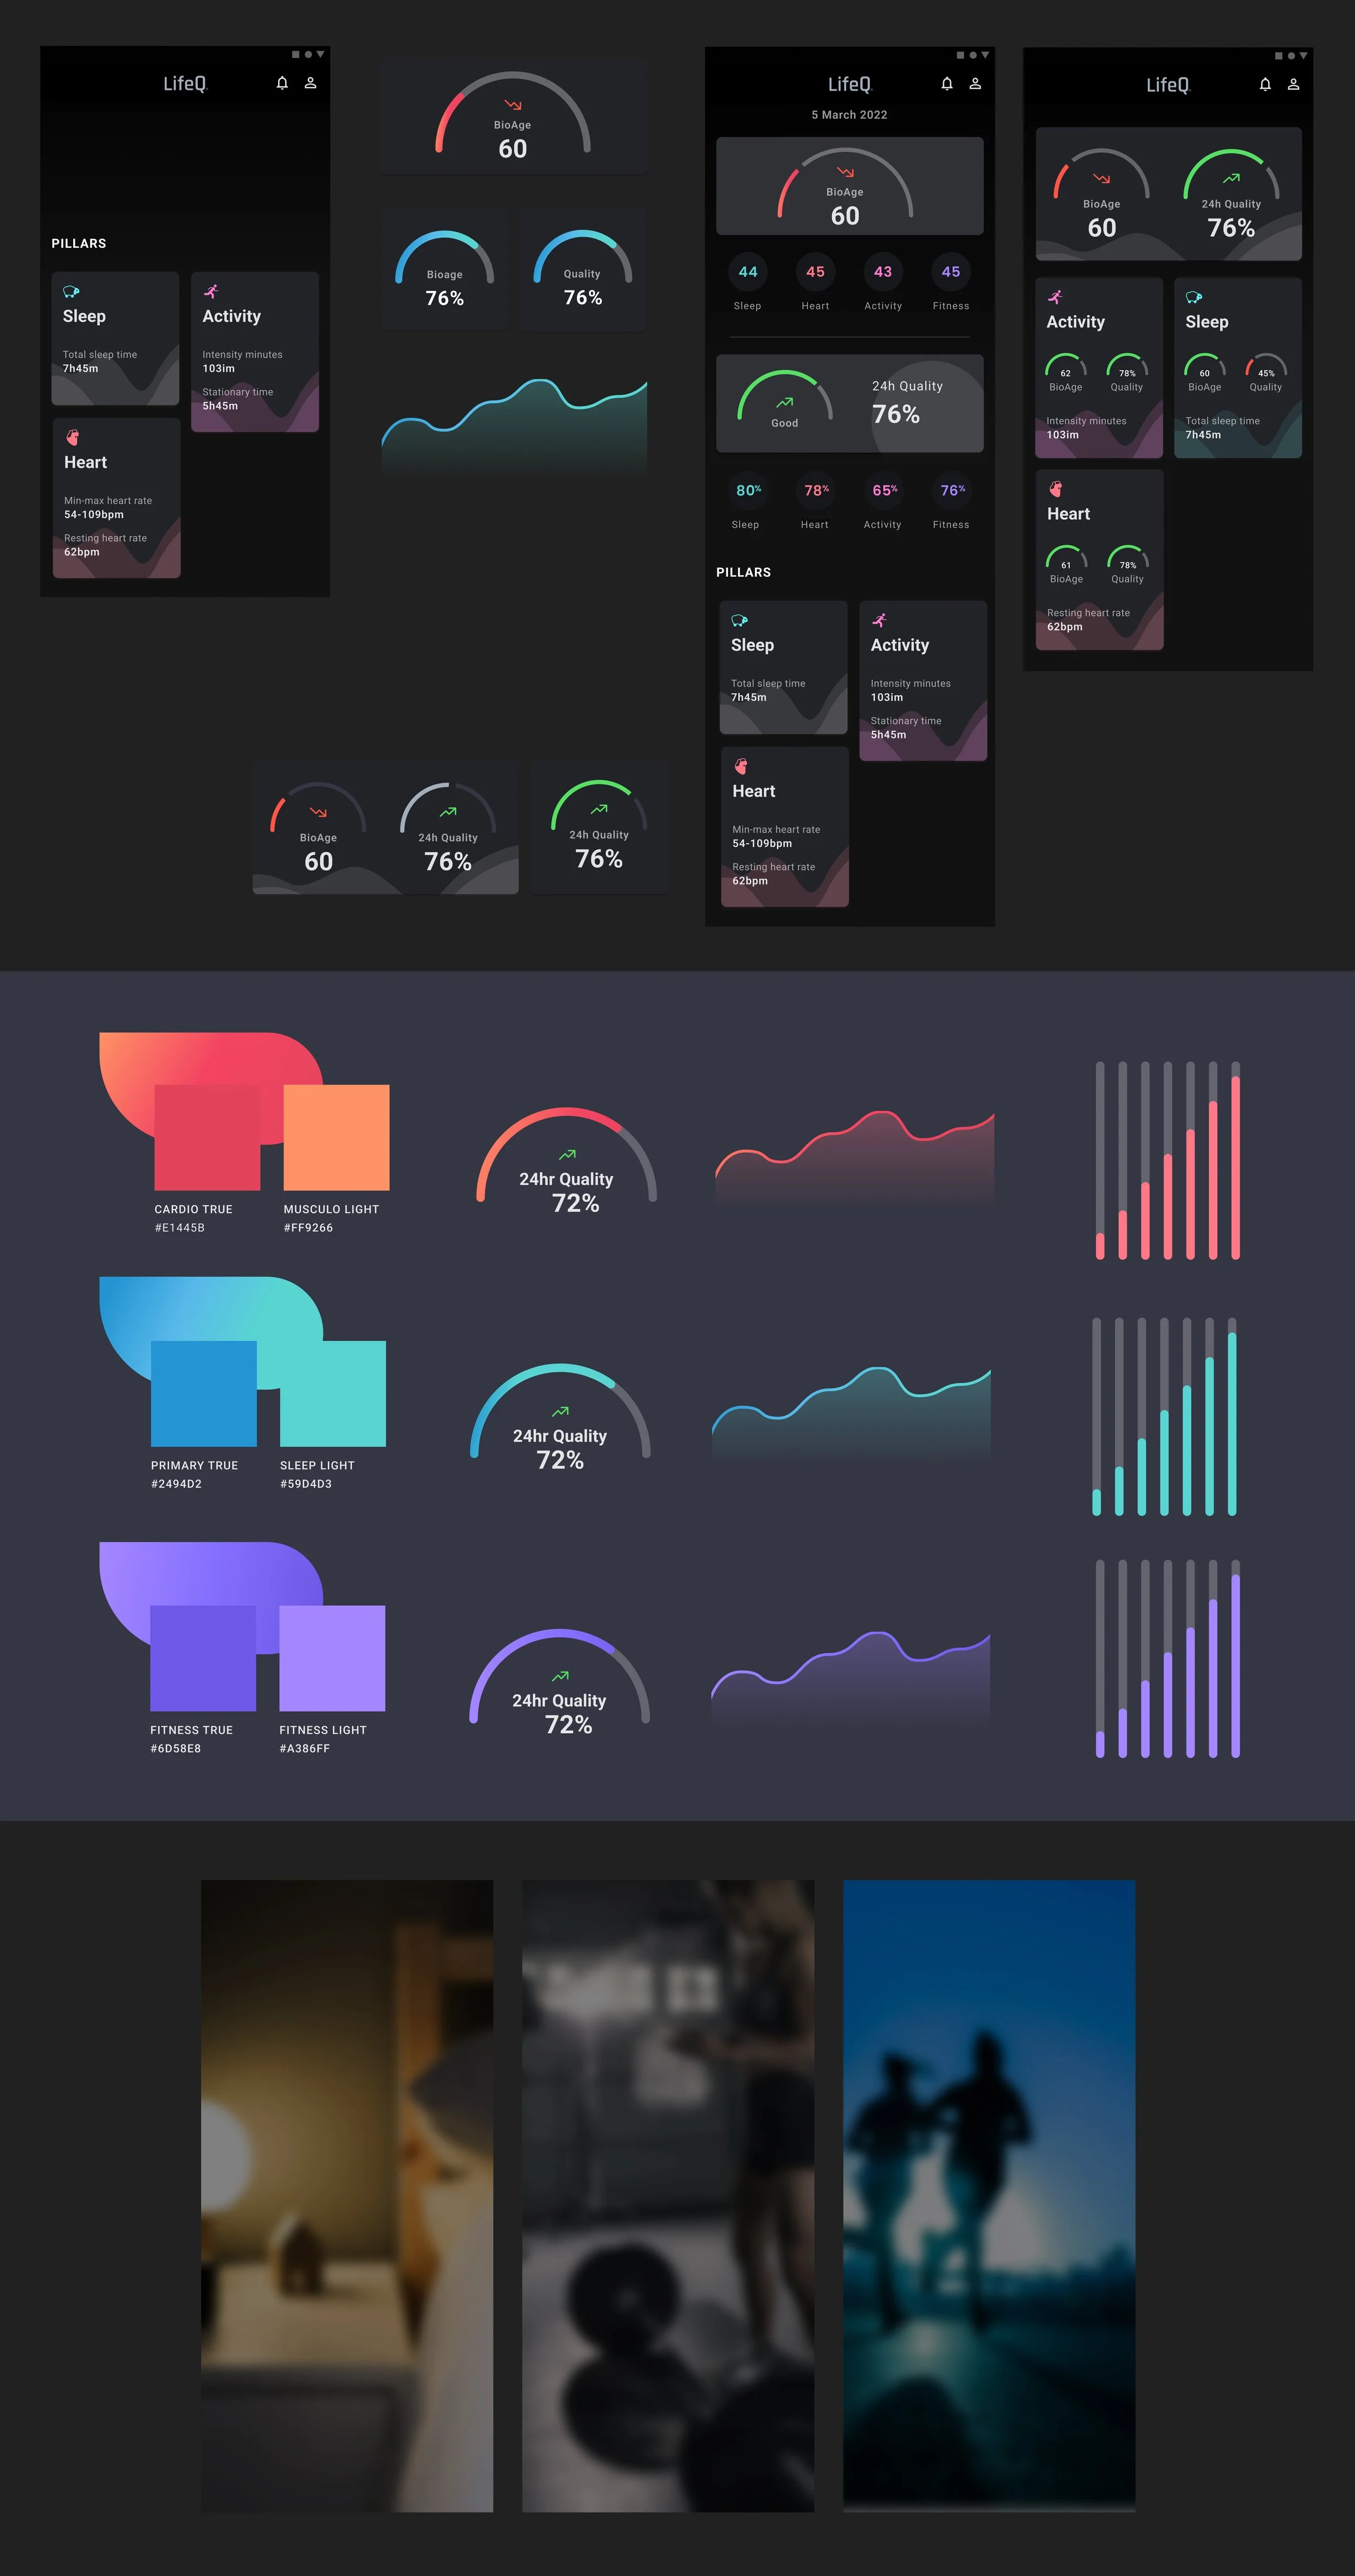
-
Developed high-fidelity concepts to explore tone, visual identity, and emotional impact
Experimented with visual treatments for key metrics (e.g., BioAge, recovery, sleep quality)
Refined microcopy and contextual guidance to support comprehension
Validated clarity and engagement through rapid internal feedback loops
Established the foundation for a scalable design system
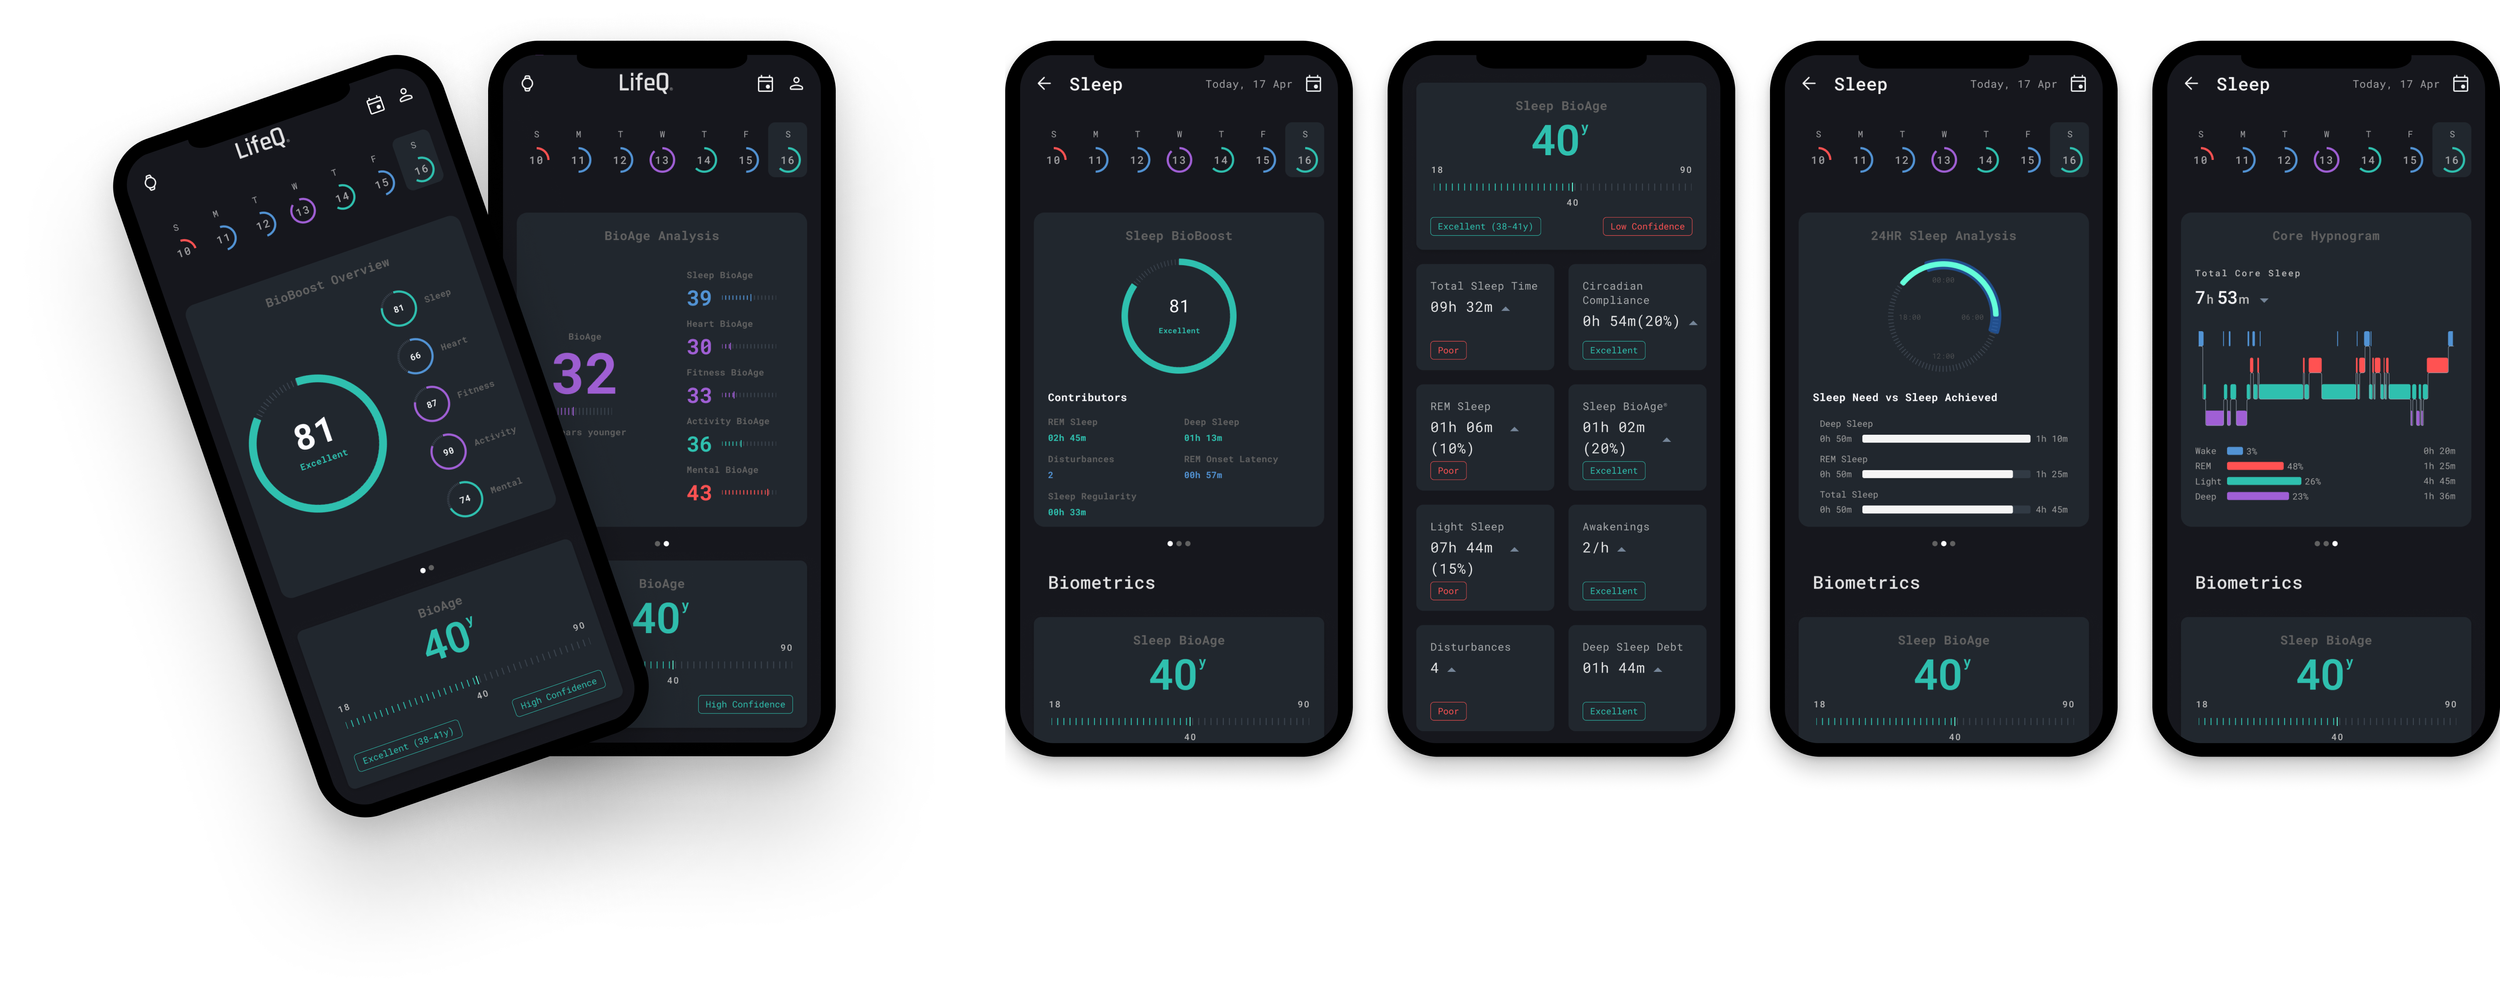
Cognitive Ergonomics and Human Factors
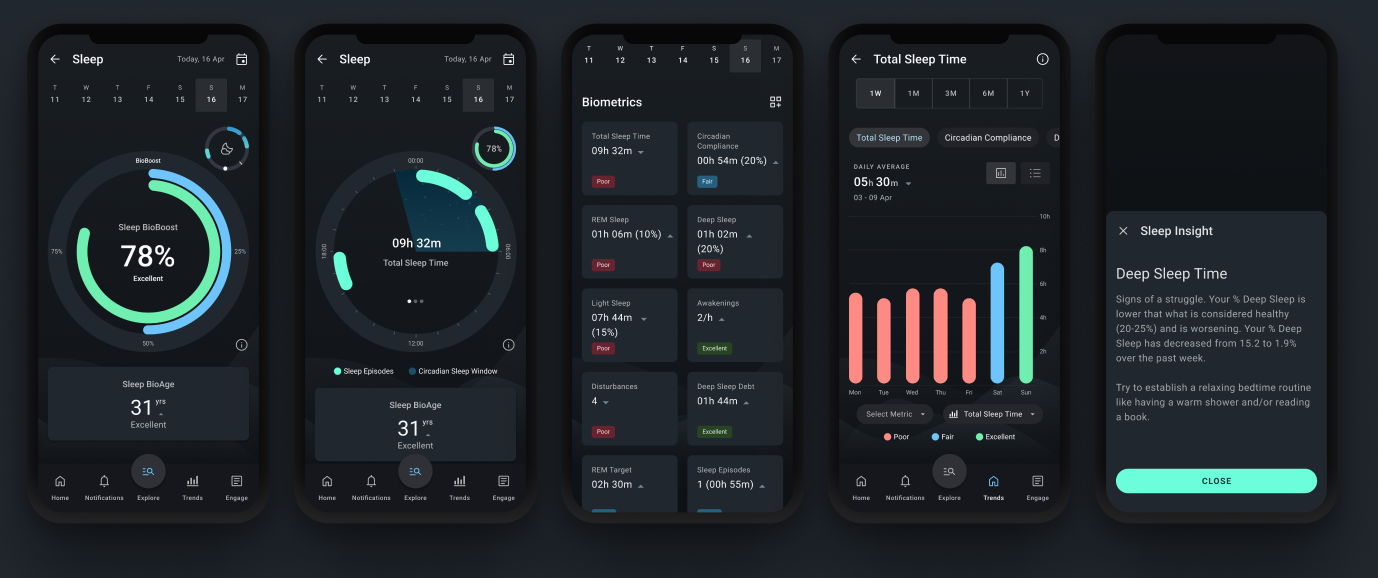
App Elements for Data & Metric Visualisation
Each visual element in the app serves a clear purpose — helping users understand their health data and make informed decisions.
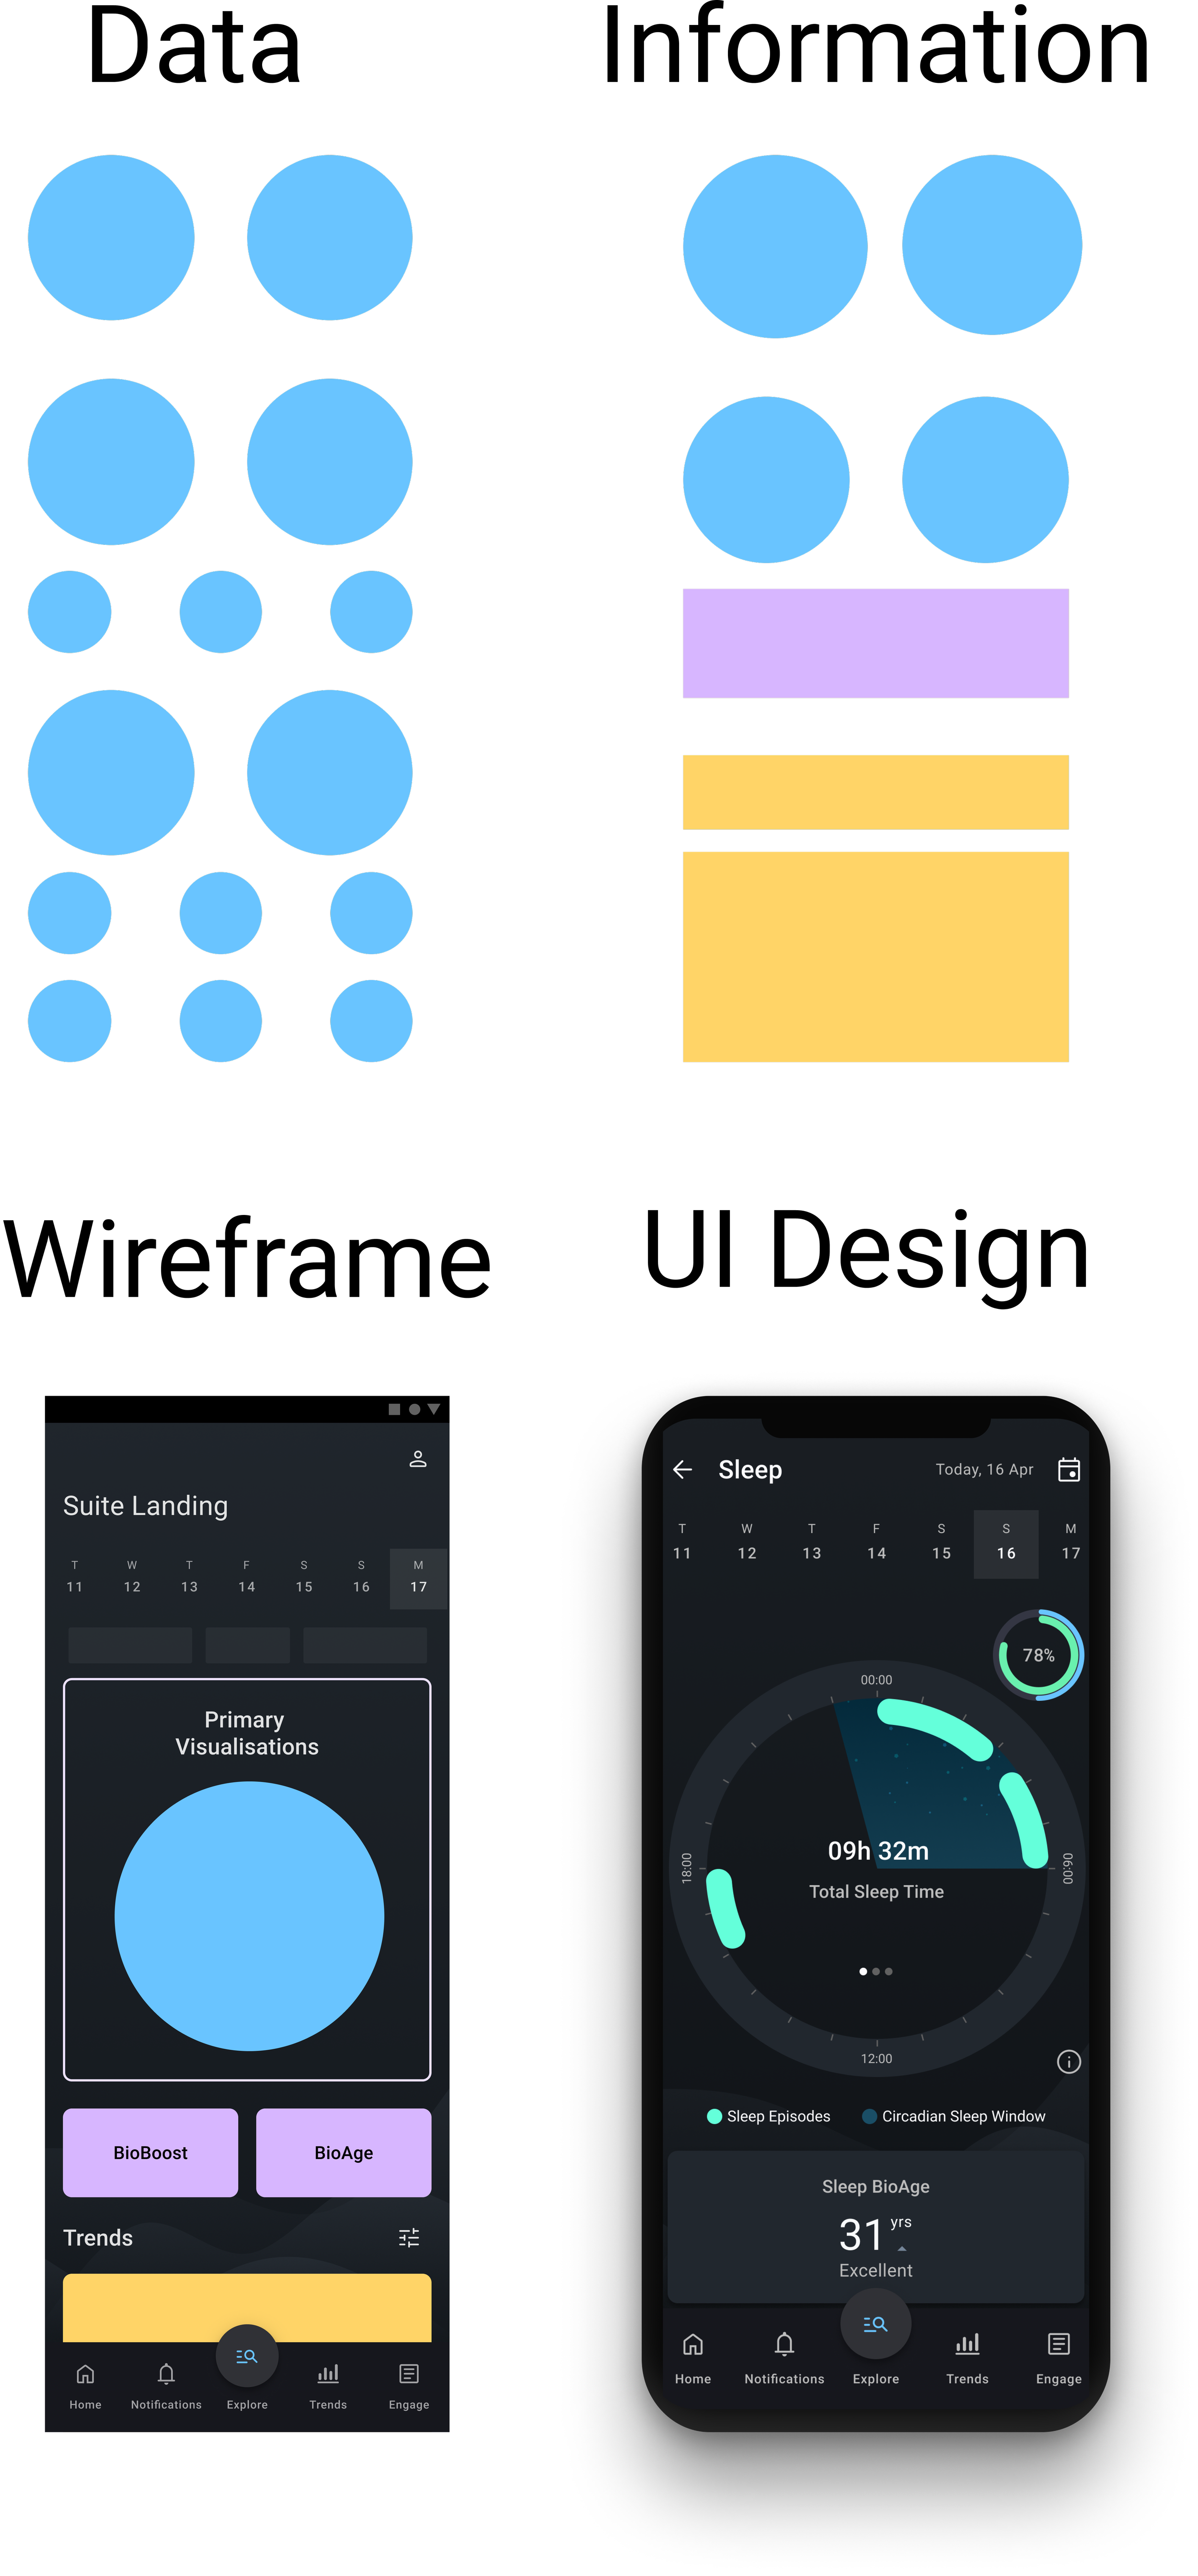
Key elements include:
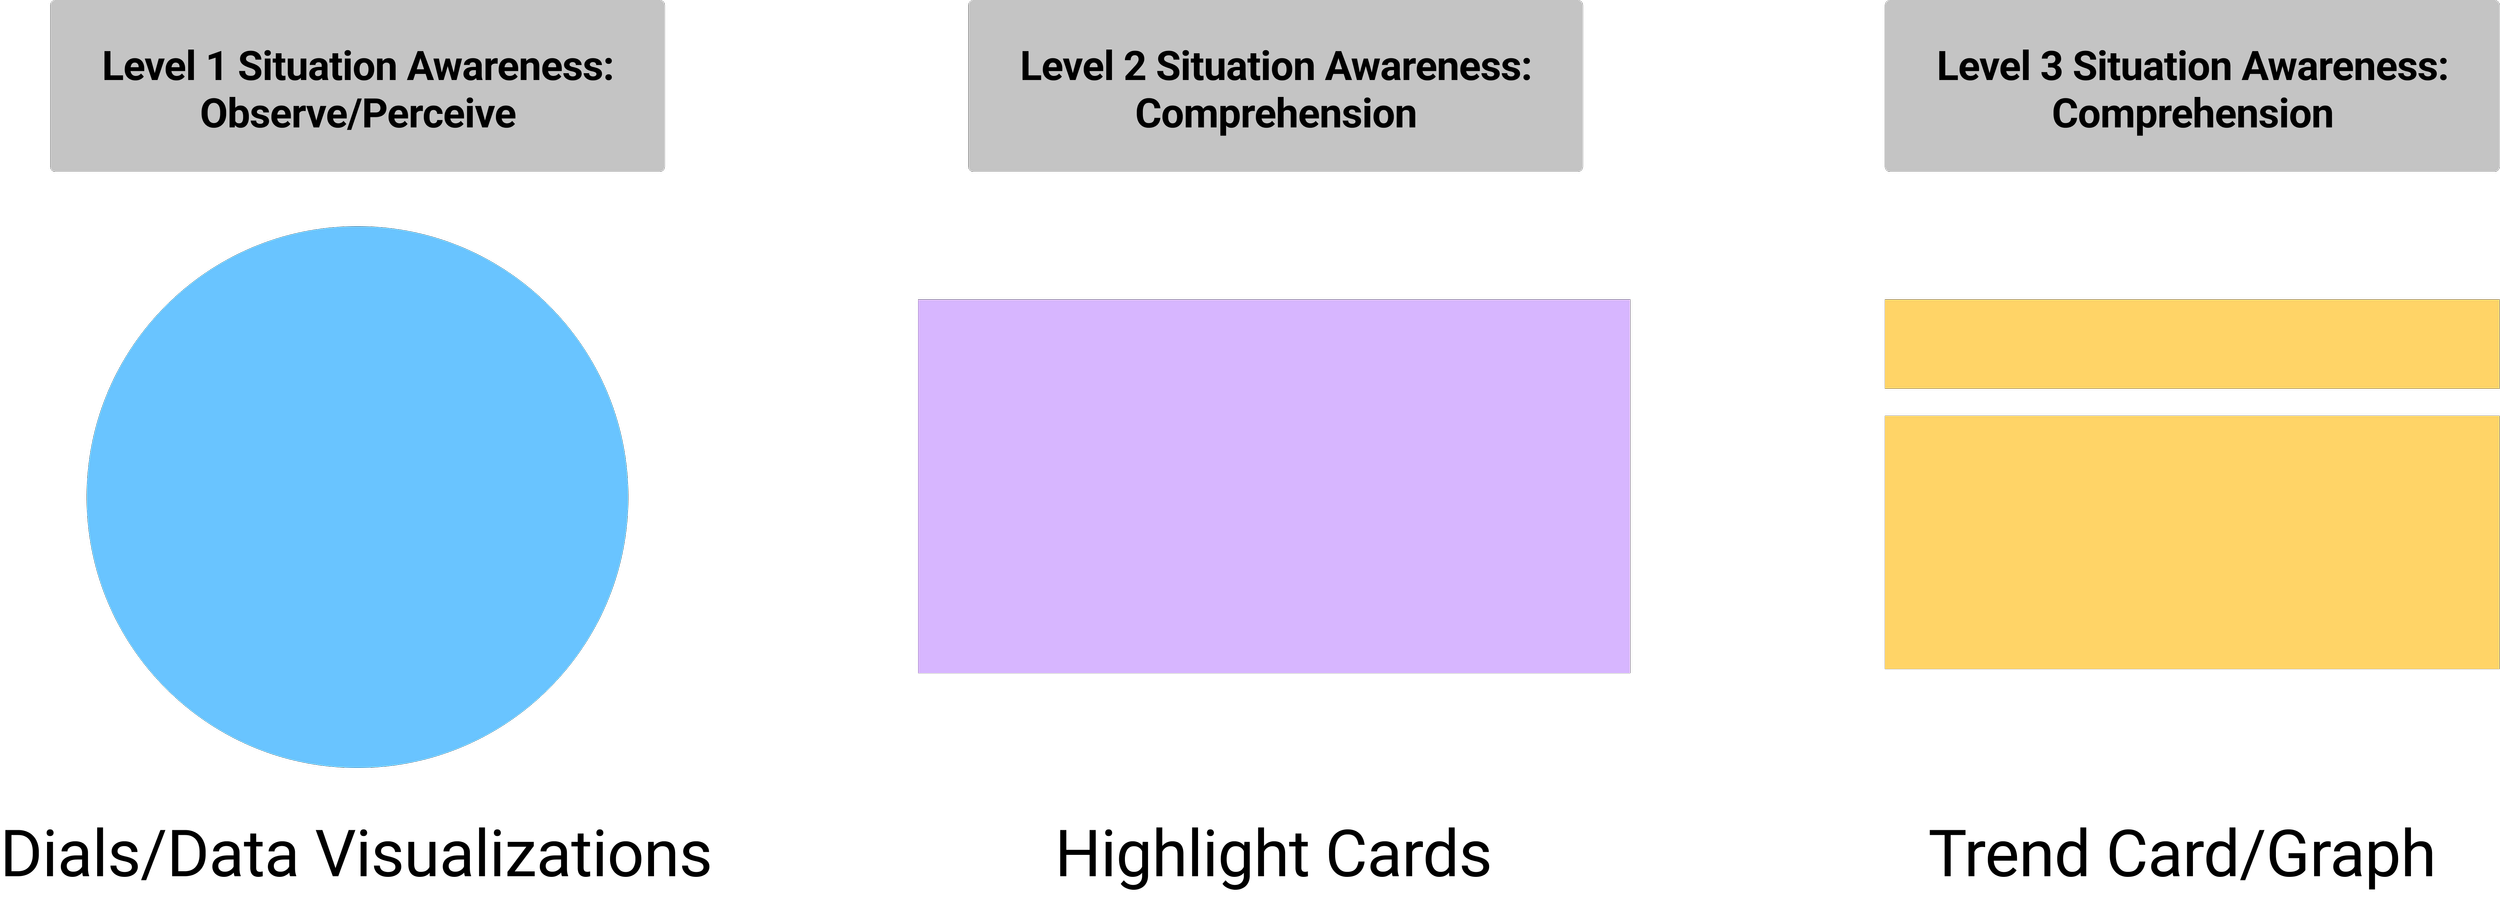
Together, these reduce cognitive load and make complex data easier to interpret at a glance.
To provide a complete picture, or strong situation awareness, information is organized into logical groupings and presented in different visual formats.
User Research
Two Approaches of User Research were used:
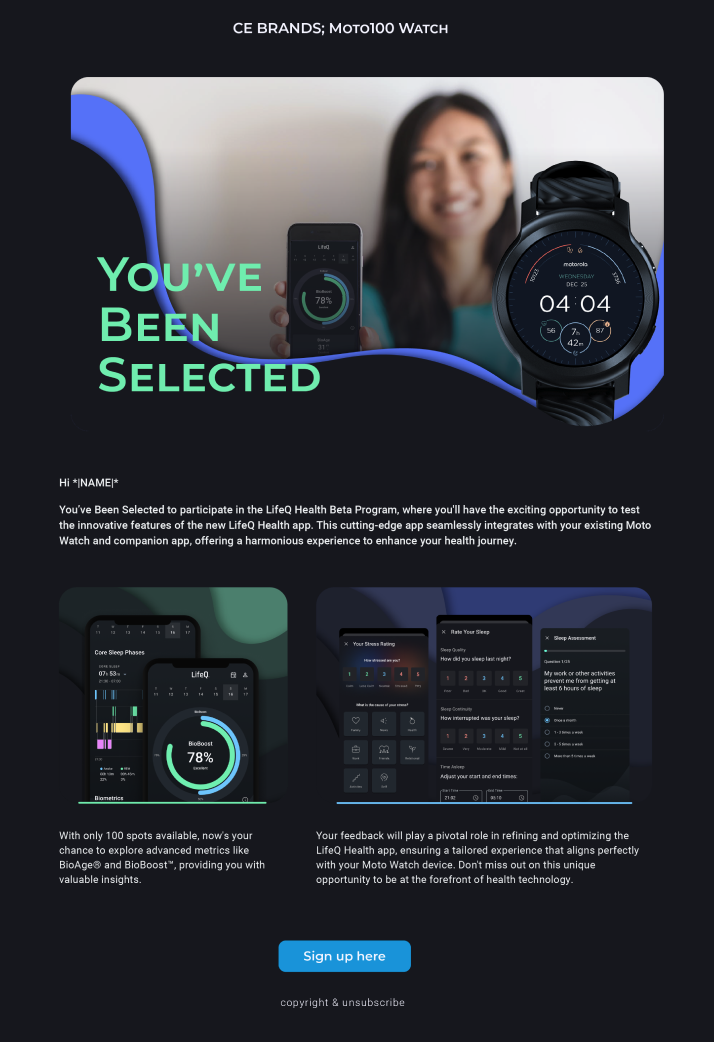
Maze to run rapid, unmoderated validation cycles on key flows and data visualisations. While we used internal dogfooders and external Beta Testing for longitudinal validation.
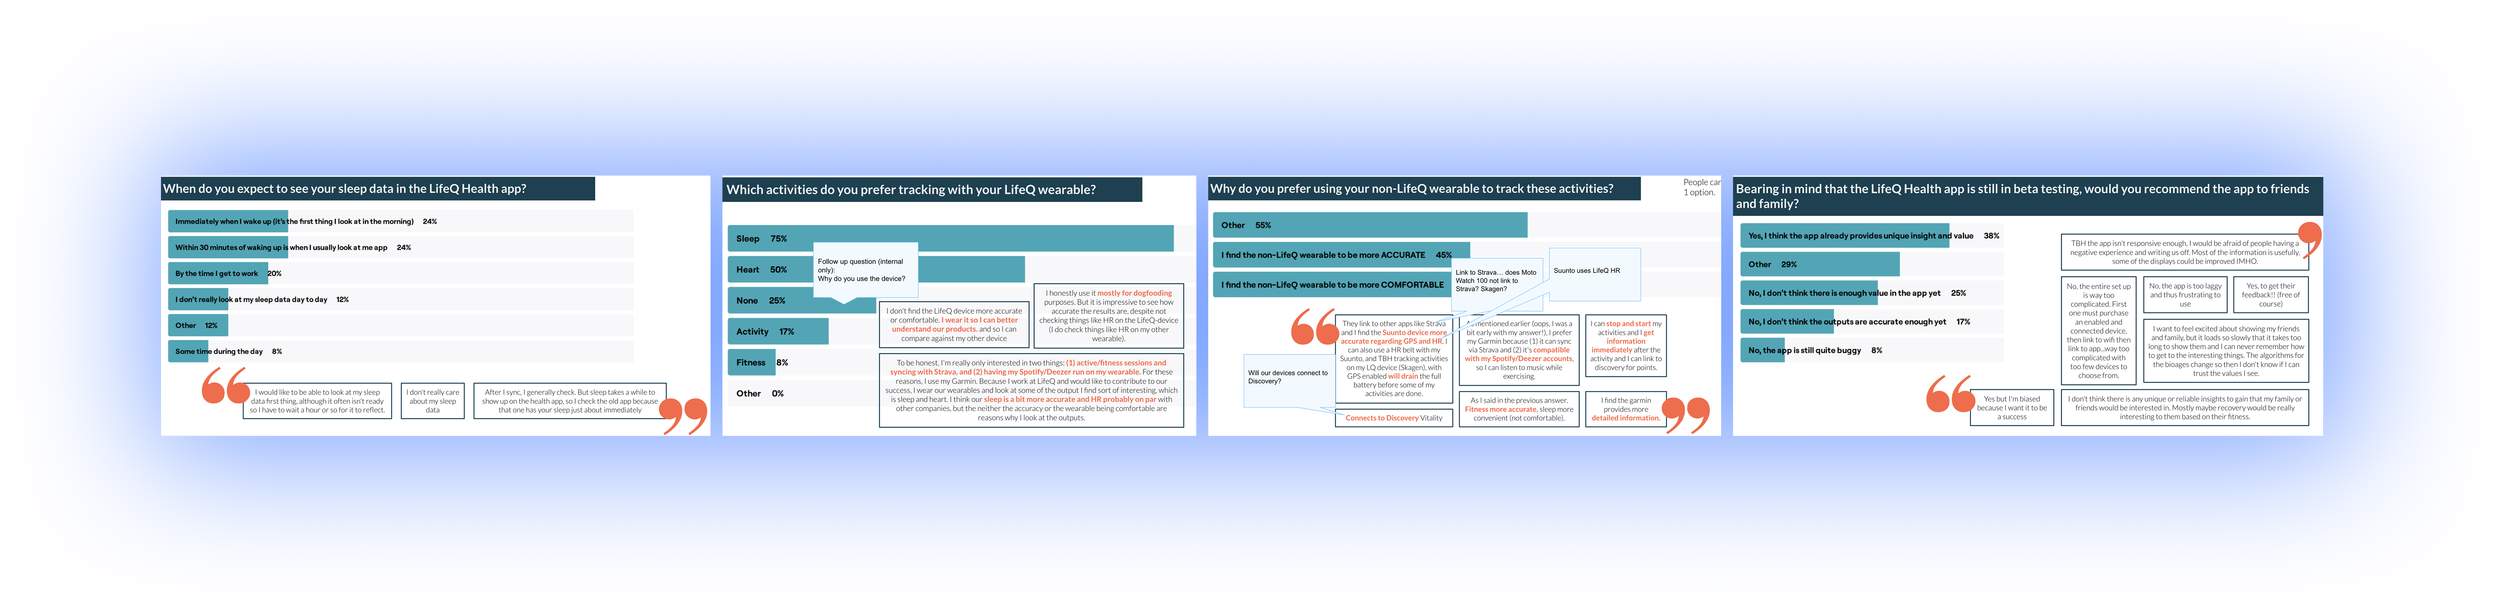
-
Task-based usability testing
Participants completed defined goals (e.g., “Identify your recovery trend this week”).
→ Measured success rate, misclicks, and time-to-insight.• 5-second tests
Tested first-impression clarity of the data.
→ Assessed whether users understood key health signals at a glance.• Follow-up open-ended questions
Captured interpretation errors and cognitive friction in participants’ own words.• A/B concept testing
Compared alternative data visualisation treatments for clarity.
-
Internal team used the app daily
Weekly structured feedback prompts
Slack-based micro-feedback capture
Observational pattern logging
When research reveals how people actually think, iteration becomes intentional — not reactive.
Iterate. Iterate. Iterate.
Crawl.
Walk.
Run.
Design should never stand still.
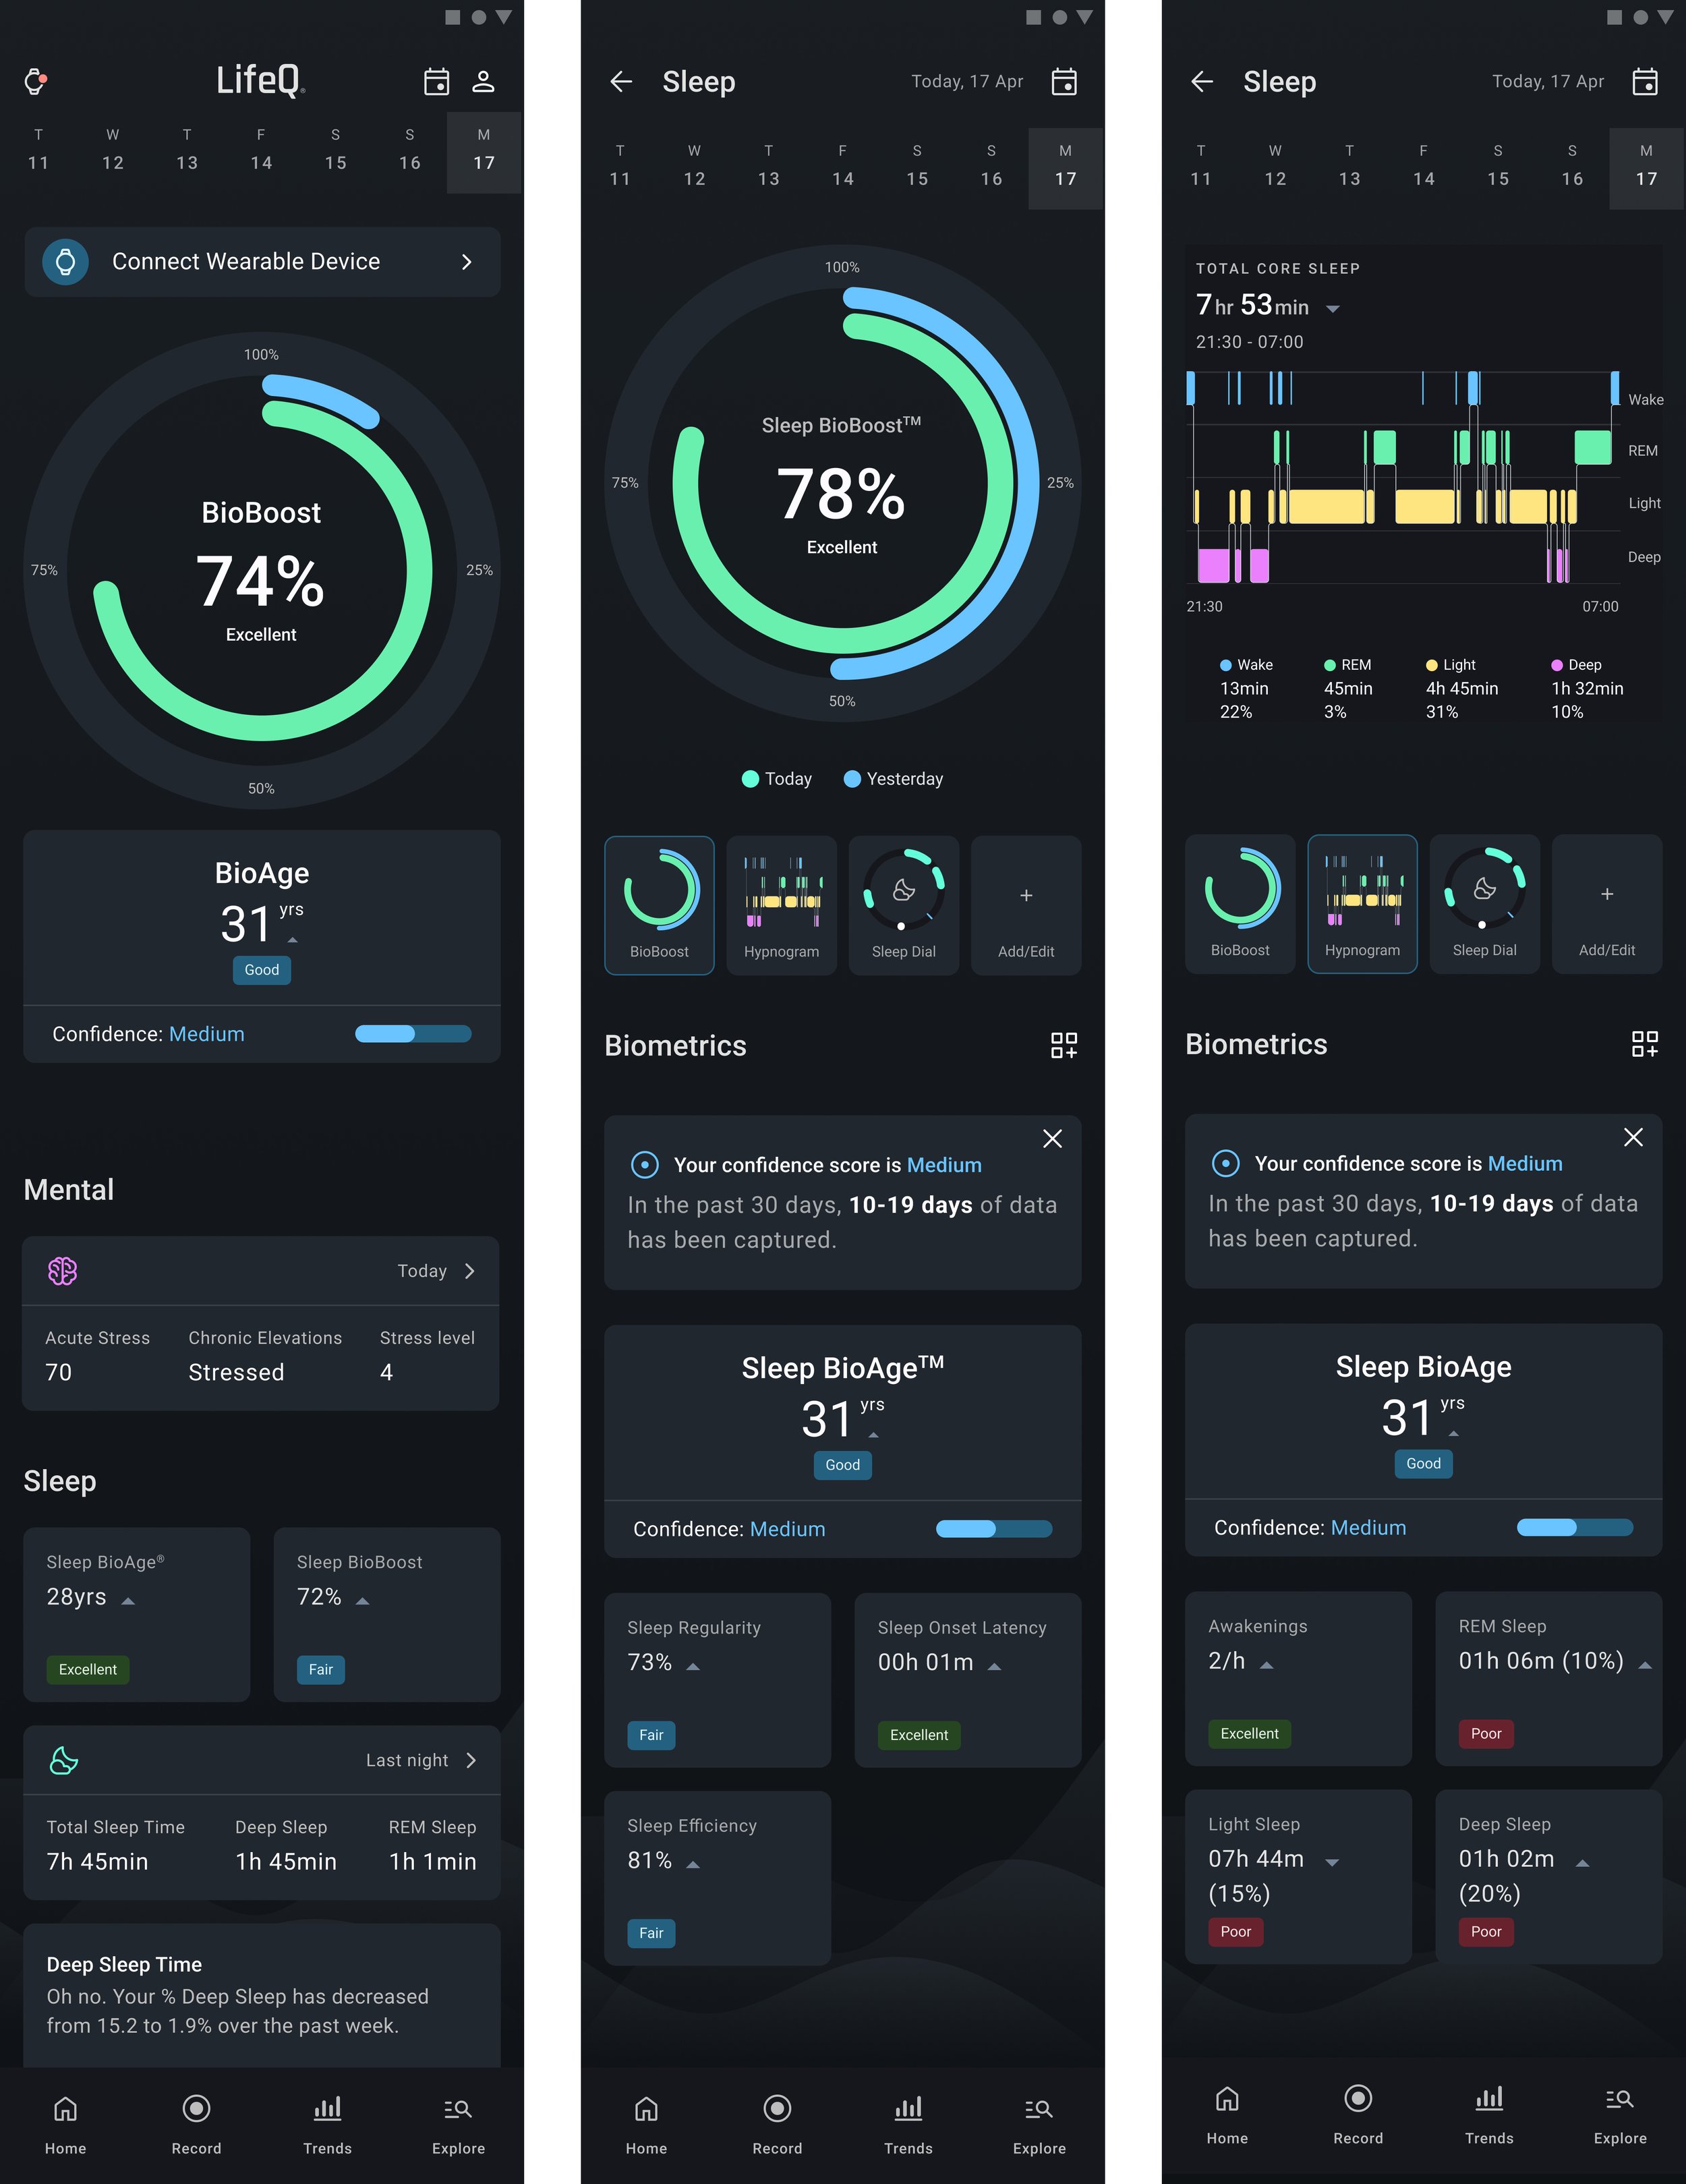
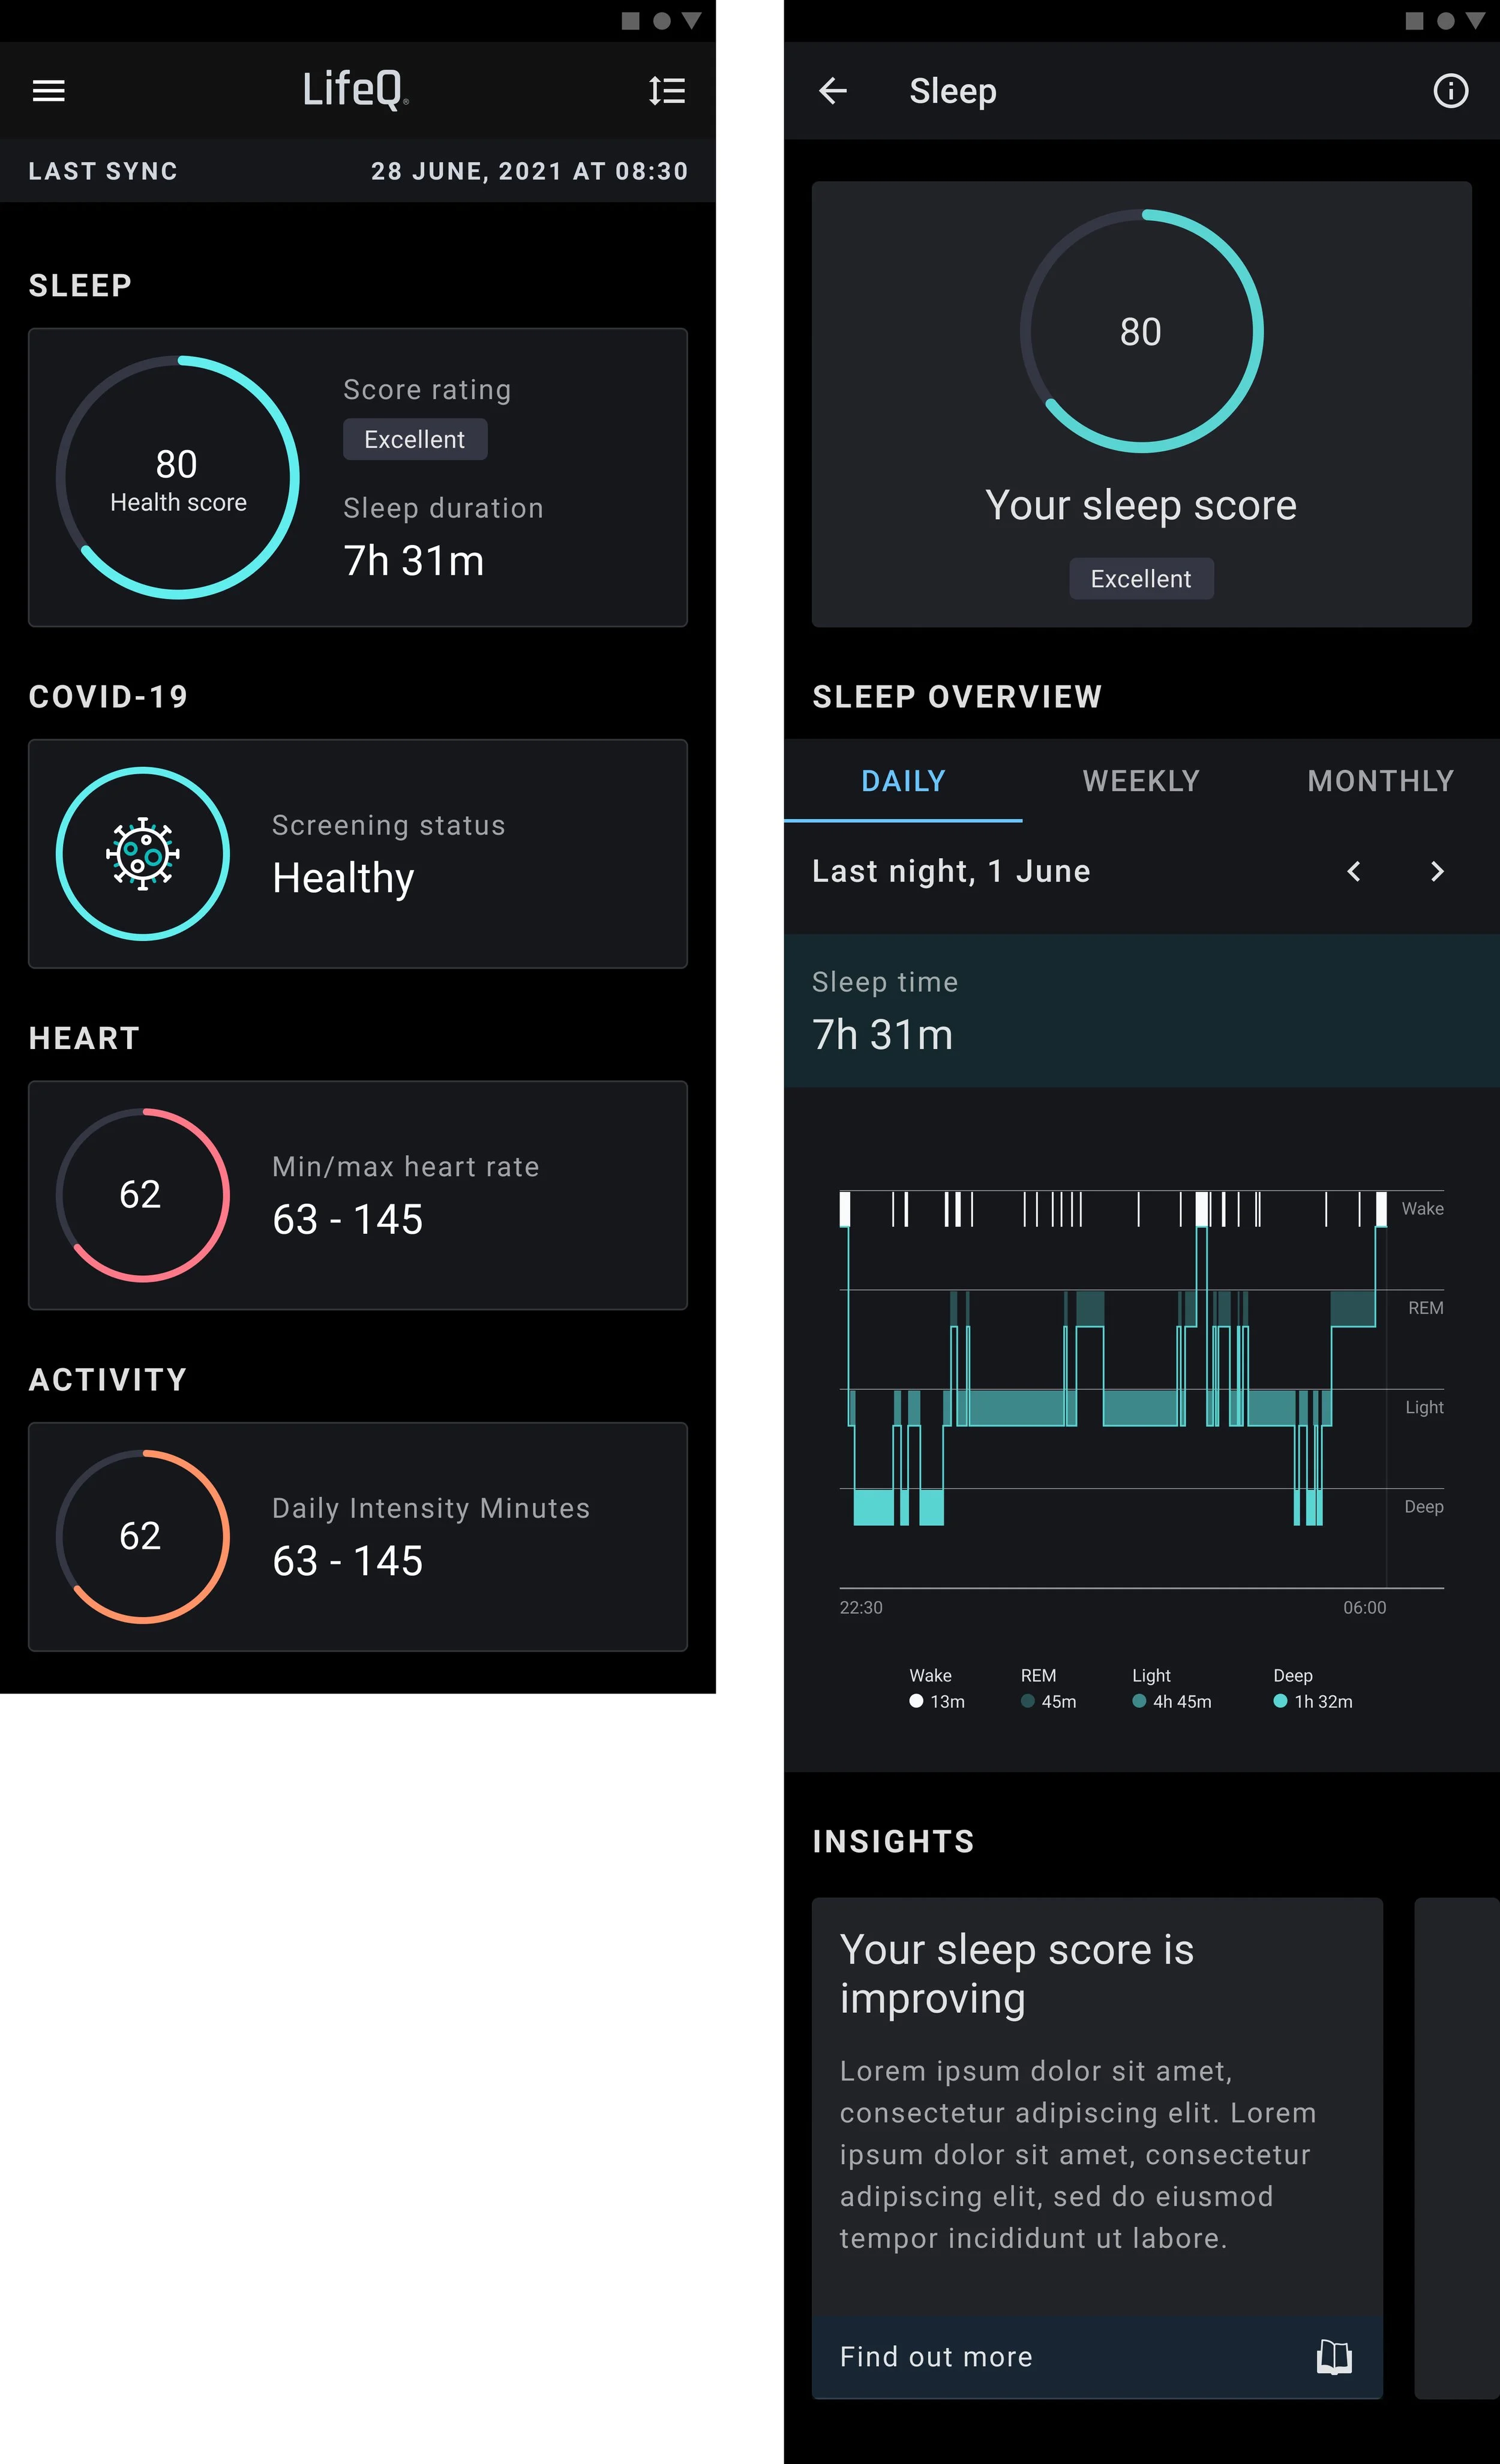
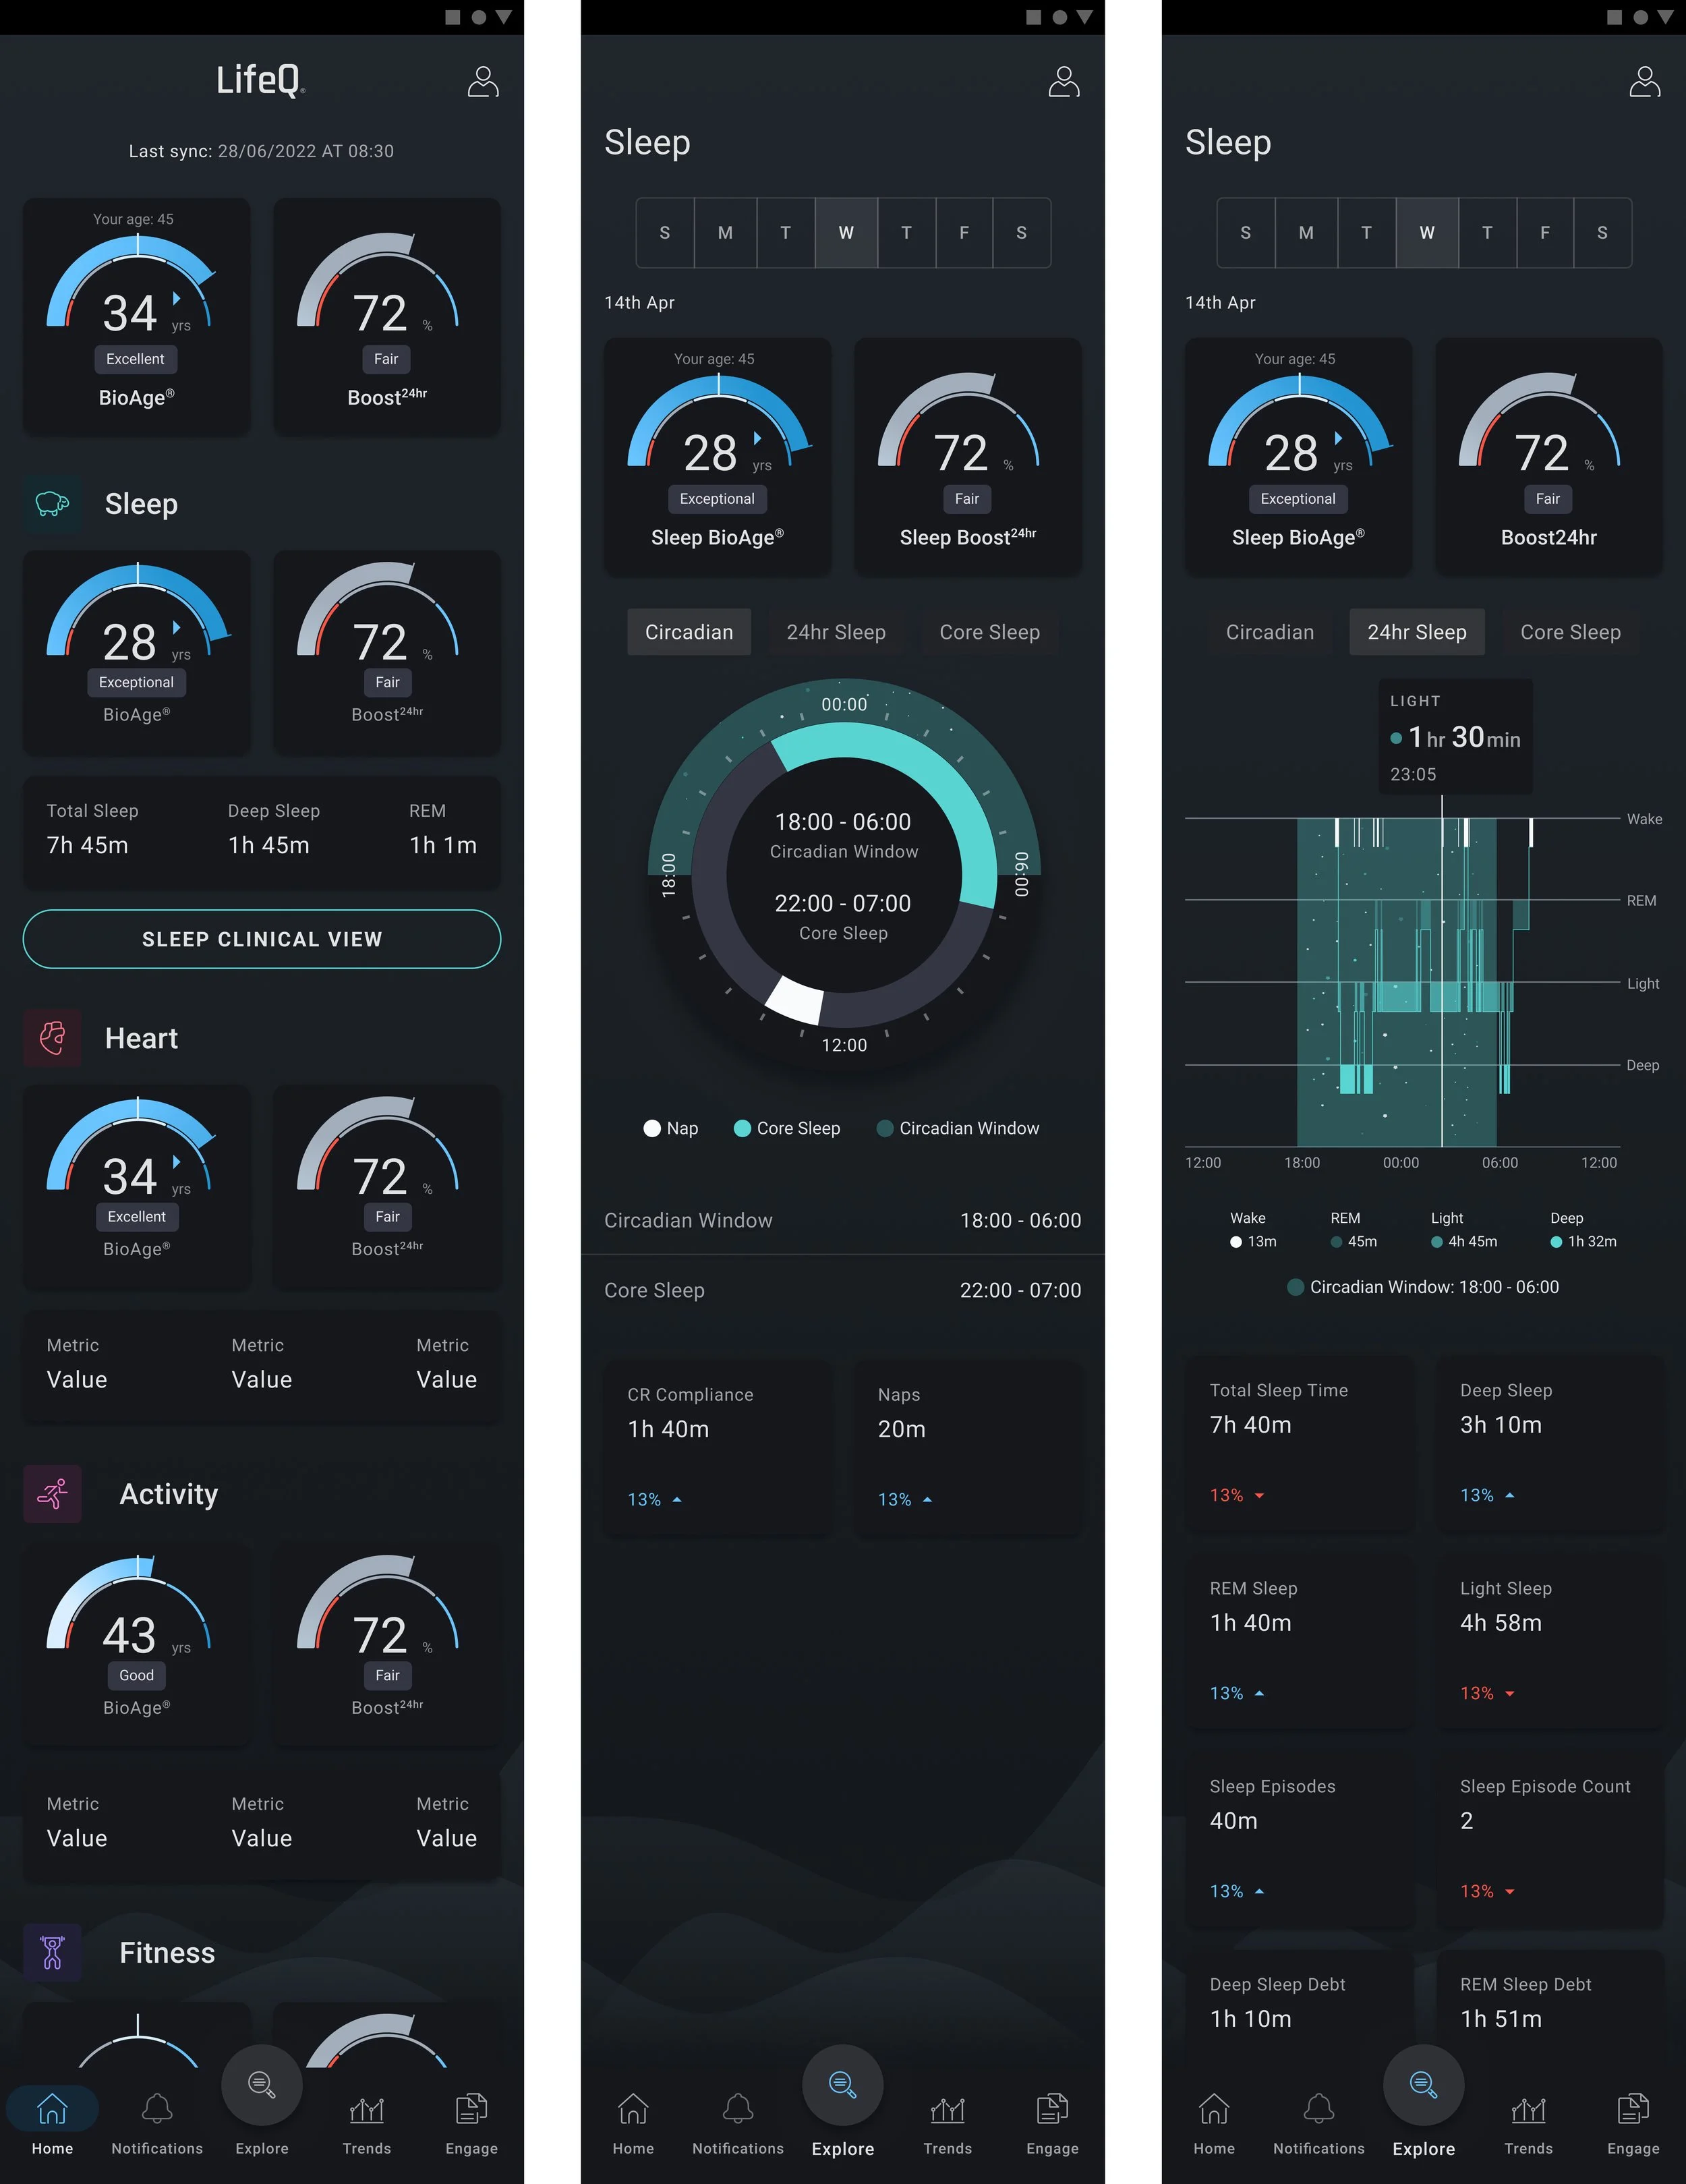
The Final Product
Available on:

The result was a comprehensive Health and Longevity app that:
Translated continuous biometric data into clear, real-time health insight
Supported situational awareness and informed lifestyle decisions
Simplified novel metrics through intuitive visualisation and progressive disclosure
Applied strong information hierarchy to reduce cognitive load and build understanding
Connected daily behaviours to long-term outcomes through a personal health narrative
Fostered engagement via meaningful feedback and visible progress
Delivered a calm, insight-driven experience balancing scientific depth with usability
Enabled users to understand what their data means and how to act on it