
CONFIGURABLE DASHBOARD
Through user feedback and extensive product market research, we discovered the challenge of designing a one-size-fits-all dashboard that caters to each unique use case. Our research revealed that no two surgeons, clinicians, or professionals within the same discipline (e.g., Cardiovascular Clinic) desired the same experience, product, or configuration.
The goal was to design a scalable dashboard system that could support diverse workflows without becoming overly complex, cluttered, or rigid.
The Configurable Dashboard serves as an all-in-one portal for clinicians across multiple verticals — including clinical care, performance optimization, and research.
PROJECT OVERVIEW:
Product: Remote Monitoring & Analytics Platform
Domain: Digital Health / Clinical Analytics
Role: UX Lead & Designer
Users: Clinicians, Surgeons, Researchers, Performance Specialists
Platforms: Web-based dashboard
Focus: Flexible, data-rich, configurable clinician experience
Tools: FIGMA, Confluence, JIRA, Maze
My Role:
Led cross-vertical discovery workshops
Conducted clinician interviews and workflow mapping
Defined dashboard architecture principles
Designed modular component system in Figma
Collaborated with engineering on data visualization constraints
Balanced flexibility with usability and performance
Through user interviews, shadowing sessions, and product-market research, we uncovered a critical insight:
No two clinicians — even within the same specialty — wanted the same dashboard.
The challenge:
How do you design a system that is configurable enough to serve distinct workflows — without overwhelming users or fragmenting the experience?
THE PROBLEM:
THE DESIGN GOALS:
Increase cross-vertical adoption
Enable scalable expansion into new verticals
Support diverse clinician workflows
Strengthen trust in remote monitoring data
Reduce product fragmentation
A “one-size-fits-all” dashboard would fail.
But infinite customization would create chaos.

The Design Process
-
Interviewed clinicians across multiple verticals
Shadowed real workflows and decision-making patterns
Identified variation in metric priorities — even within the same specialty
Mapped ecosystem touchpoints (wearable → Clinical app → dashboard)
Audited existing dashboards and competitor tools
-
Framed the problem: flexibility without complexity
Defined modular dashboard principles
Prioritized key workflows (triage, deep dive, longitudinal review)
Aligned dashboard and care app through shared design system
Clarified technical constraints and data requirements
-
Built modular, configurable dashboard architecture
Designed consistent time-range and filtering controls
Created clear visual hierarchy for risk and anomalies
Integrated annotations, alerts, and communication tools
Ensured cross-platform visual and functional consistency
-
Partnered with engineering on scalable component system
Optimized for high-frequency and large datasets
Iterated through usability validation
Rolled out across multiple clinical verticals
From Whiteboards to Products
-
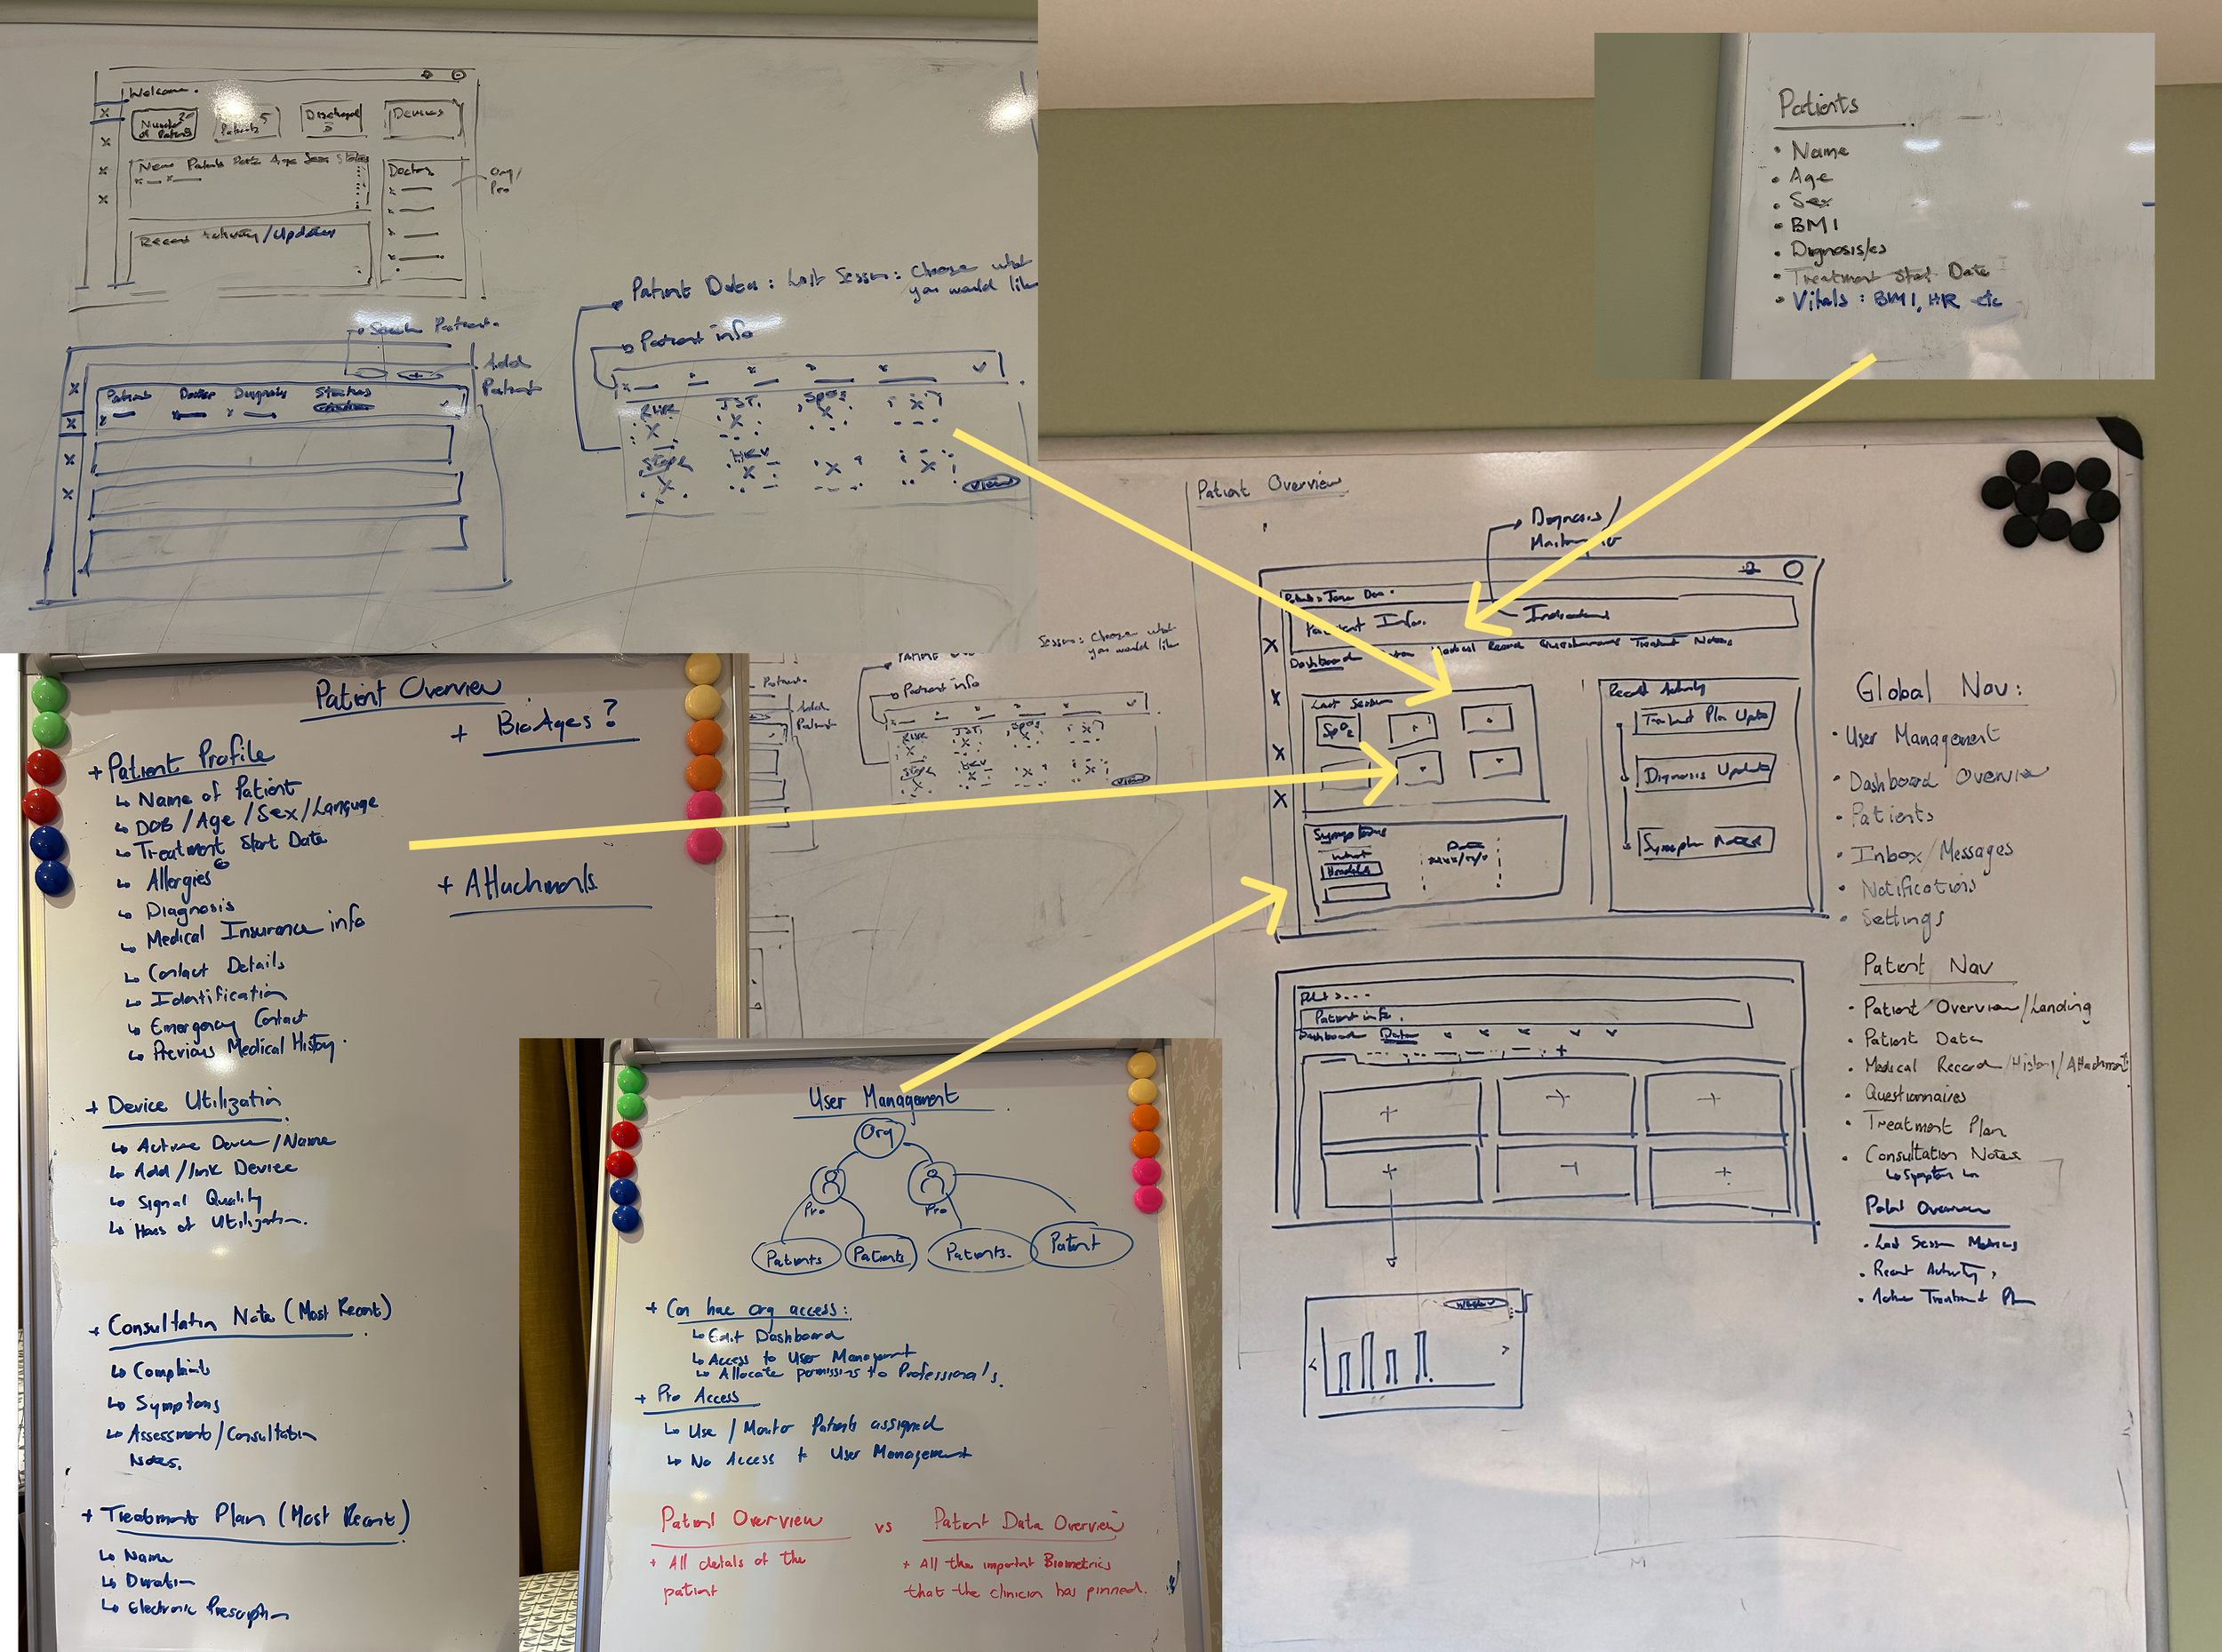
![]()
Workshops
INITIAL WIREFRAMES & STRUCTURE
-
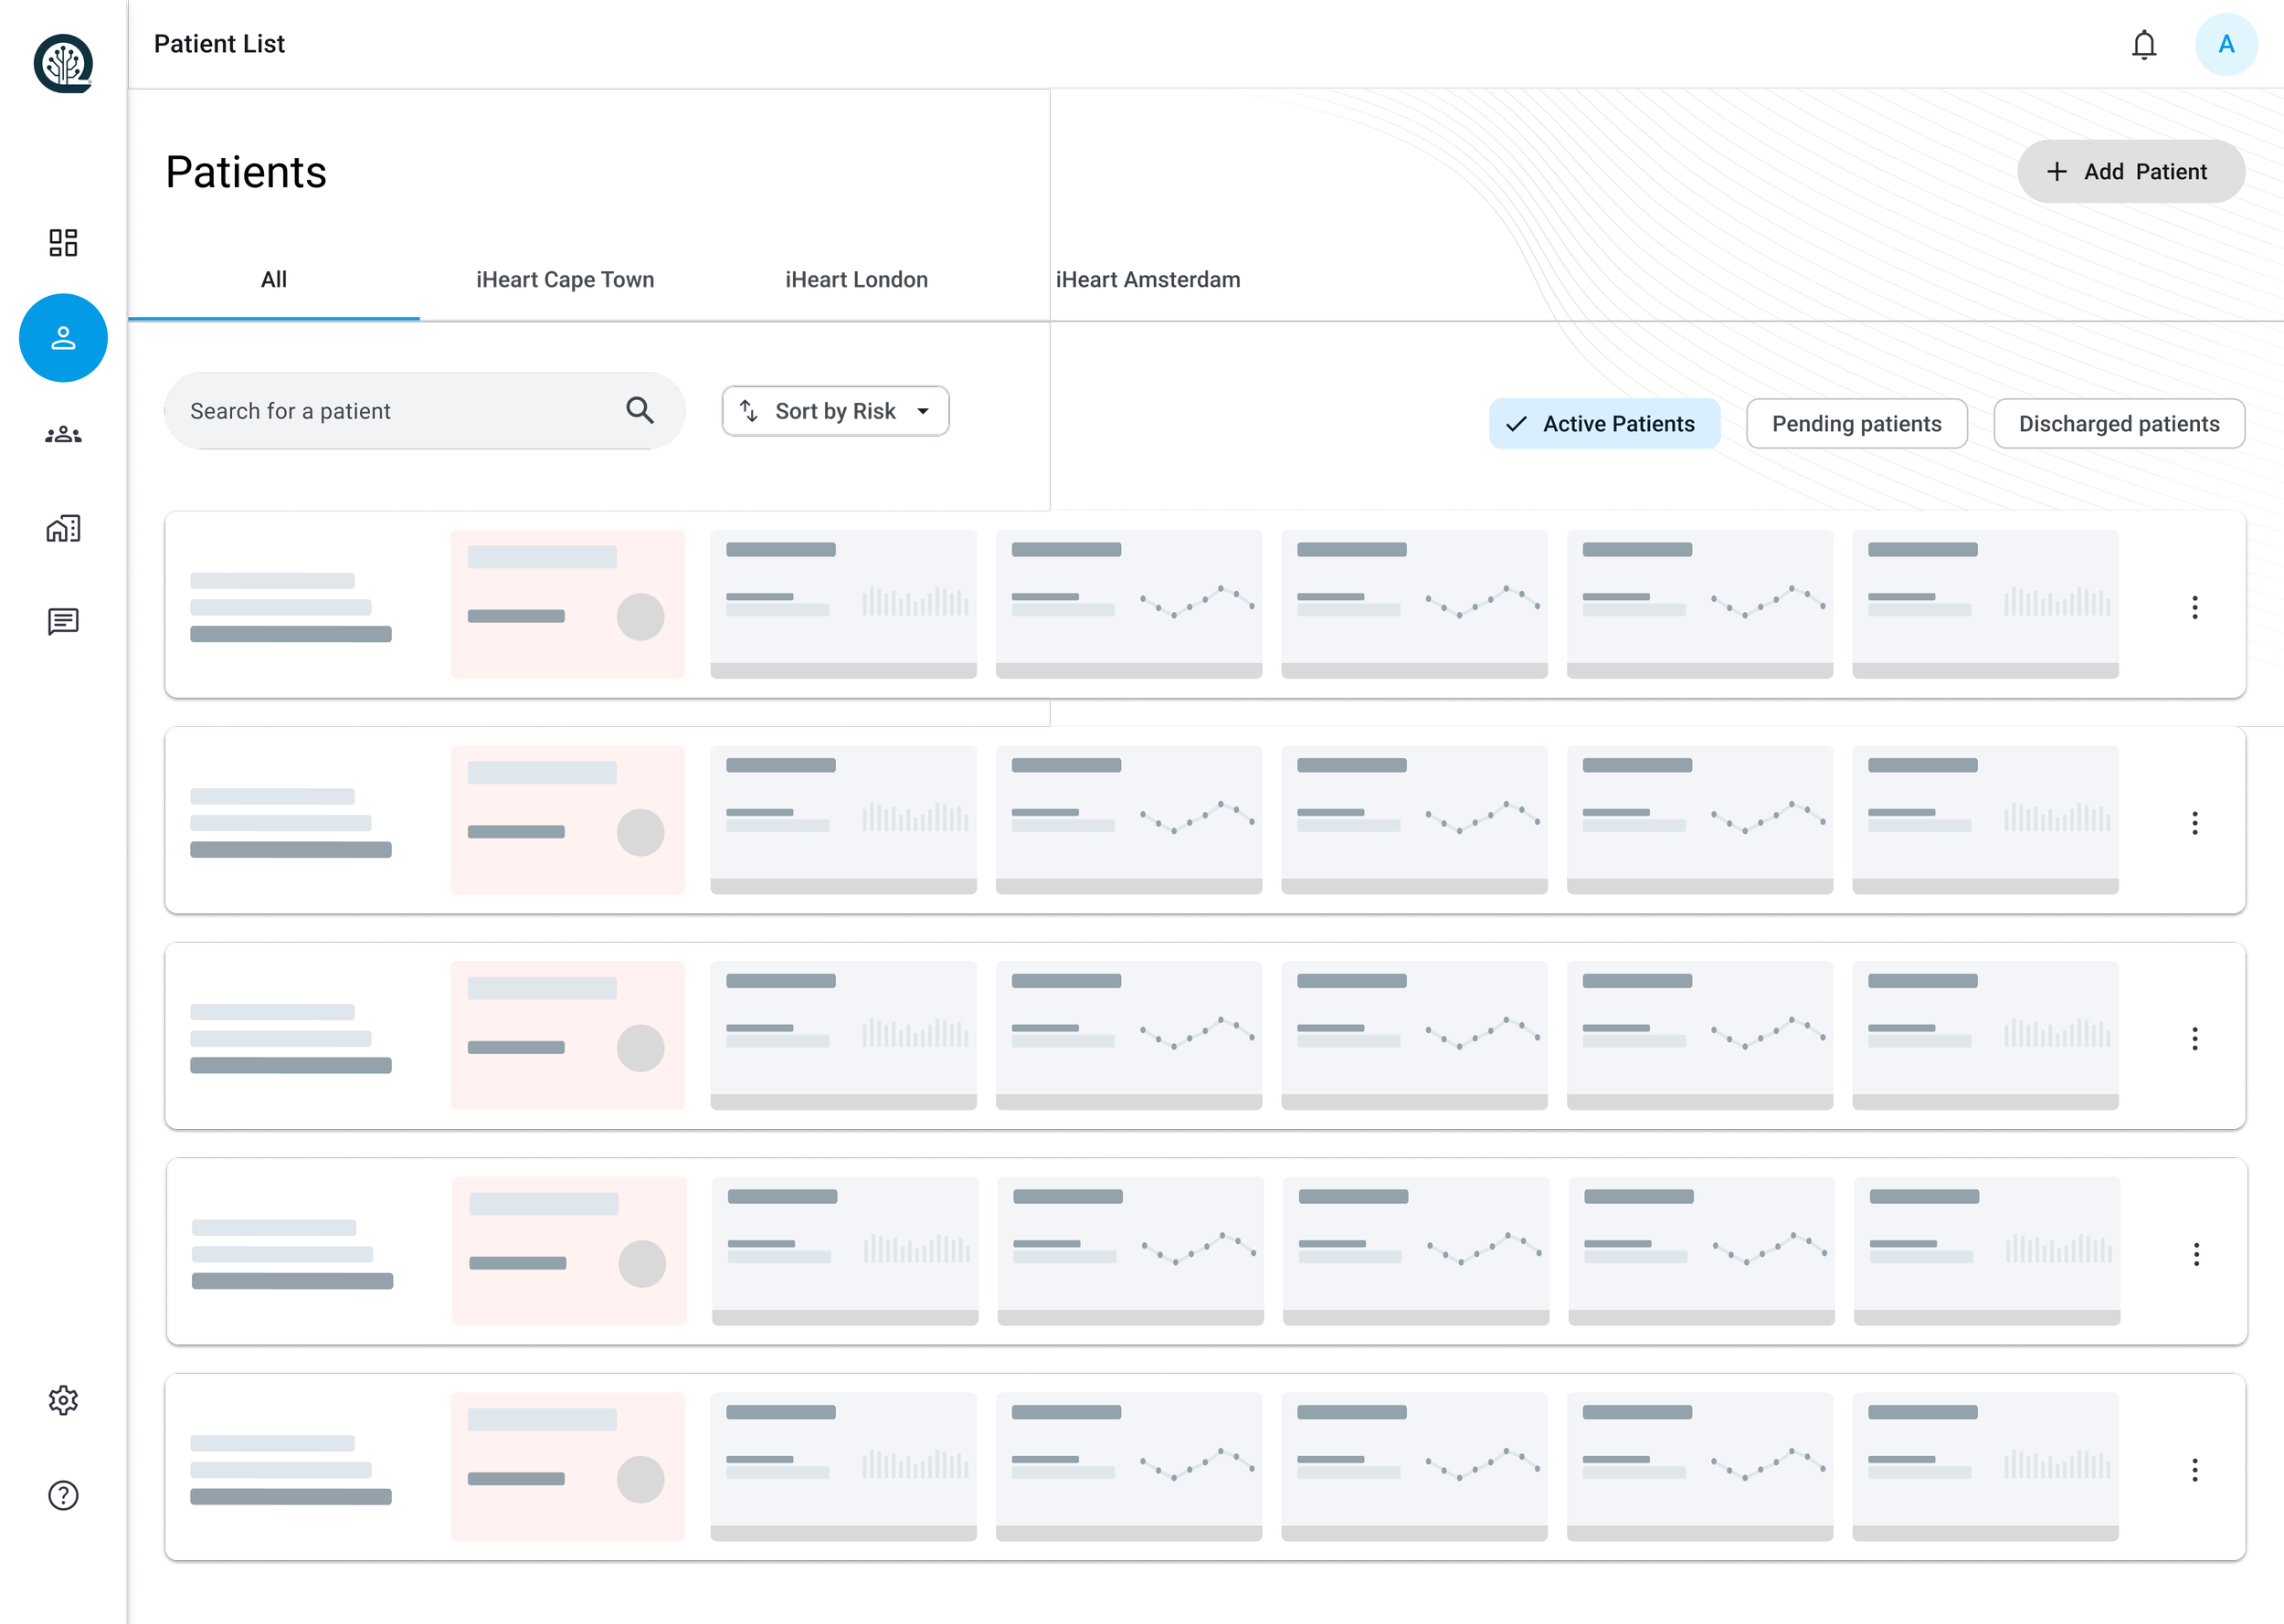
![]()
Wireframes
LOW FIDELITY WIREFRAMES
-
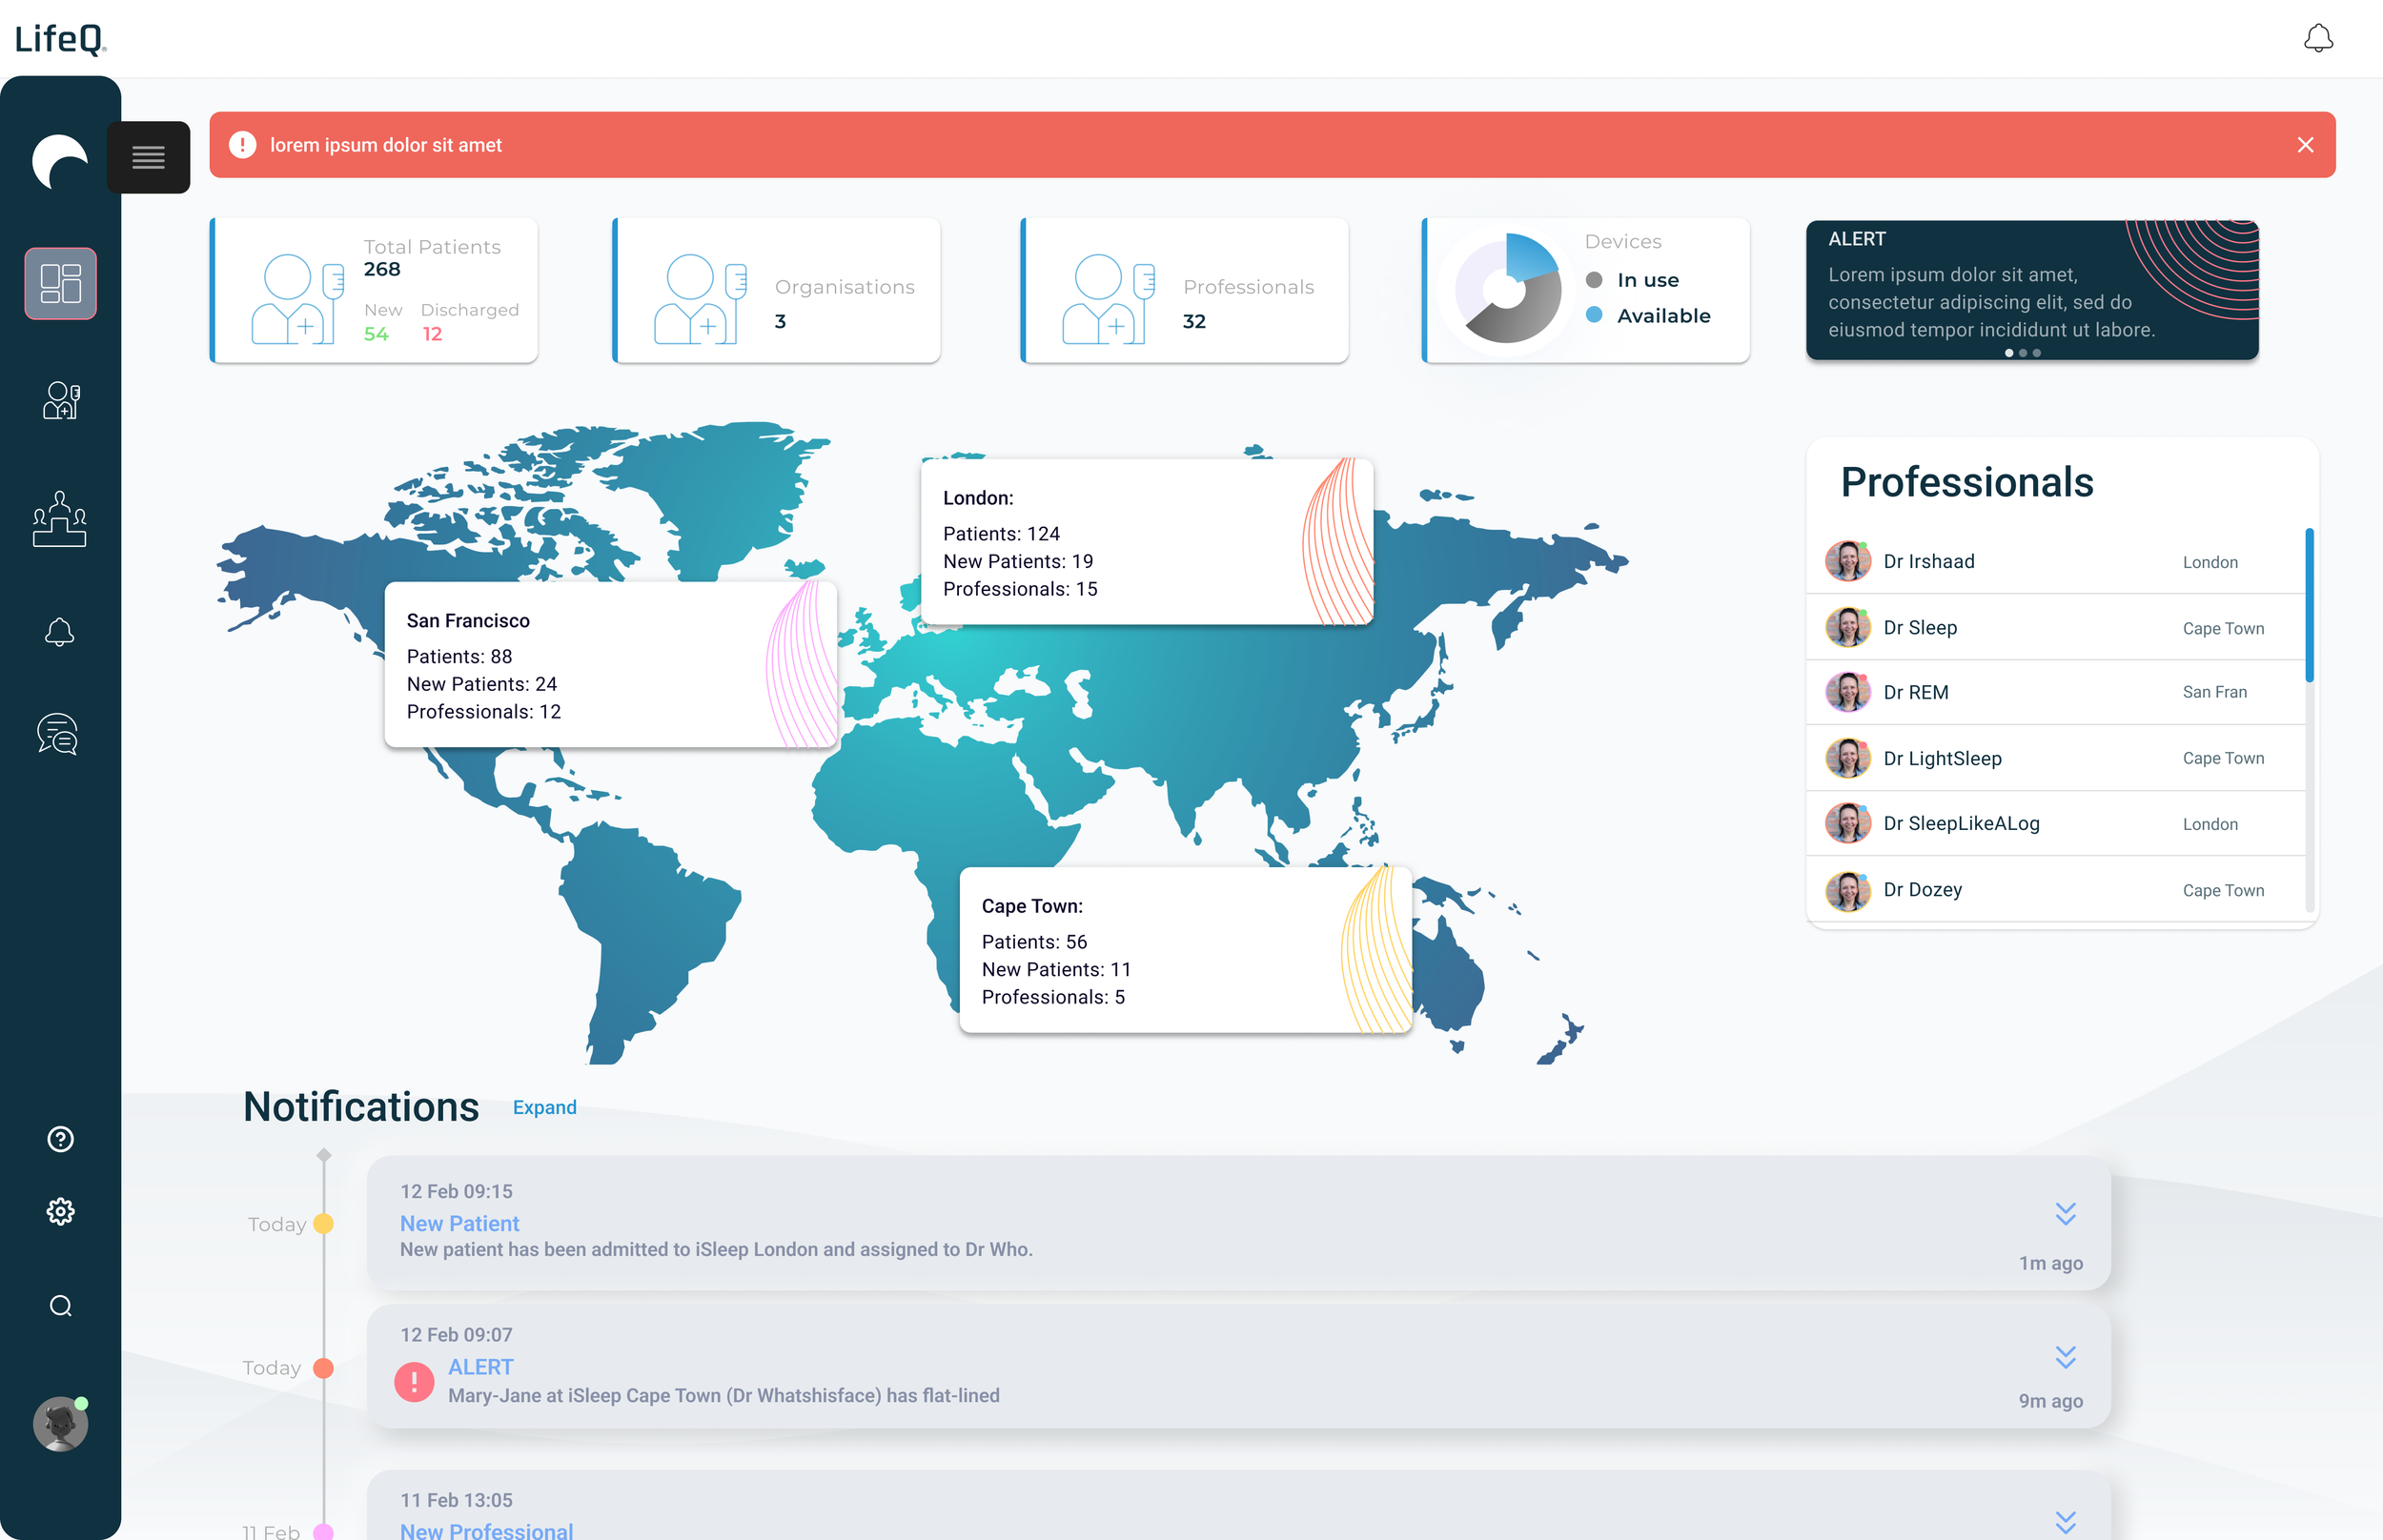
![]()
Design Concept
UX/UI CONSIDERATIONS & STRATEGY
-
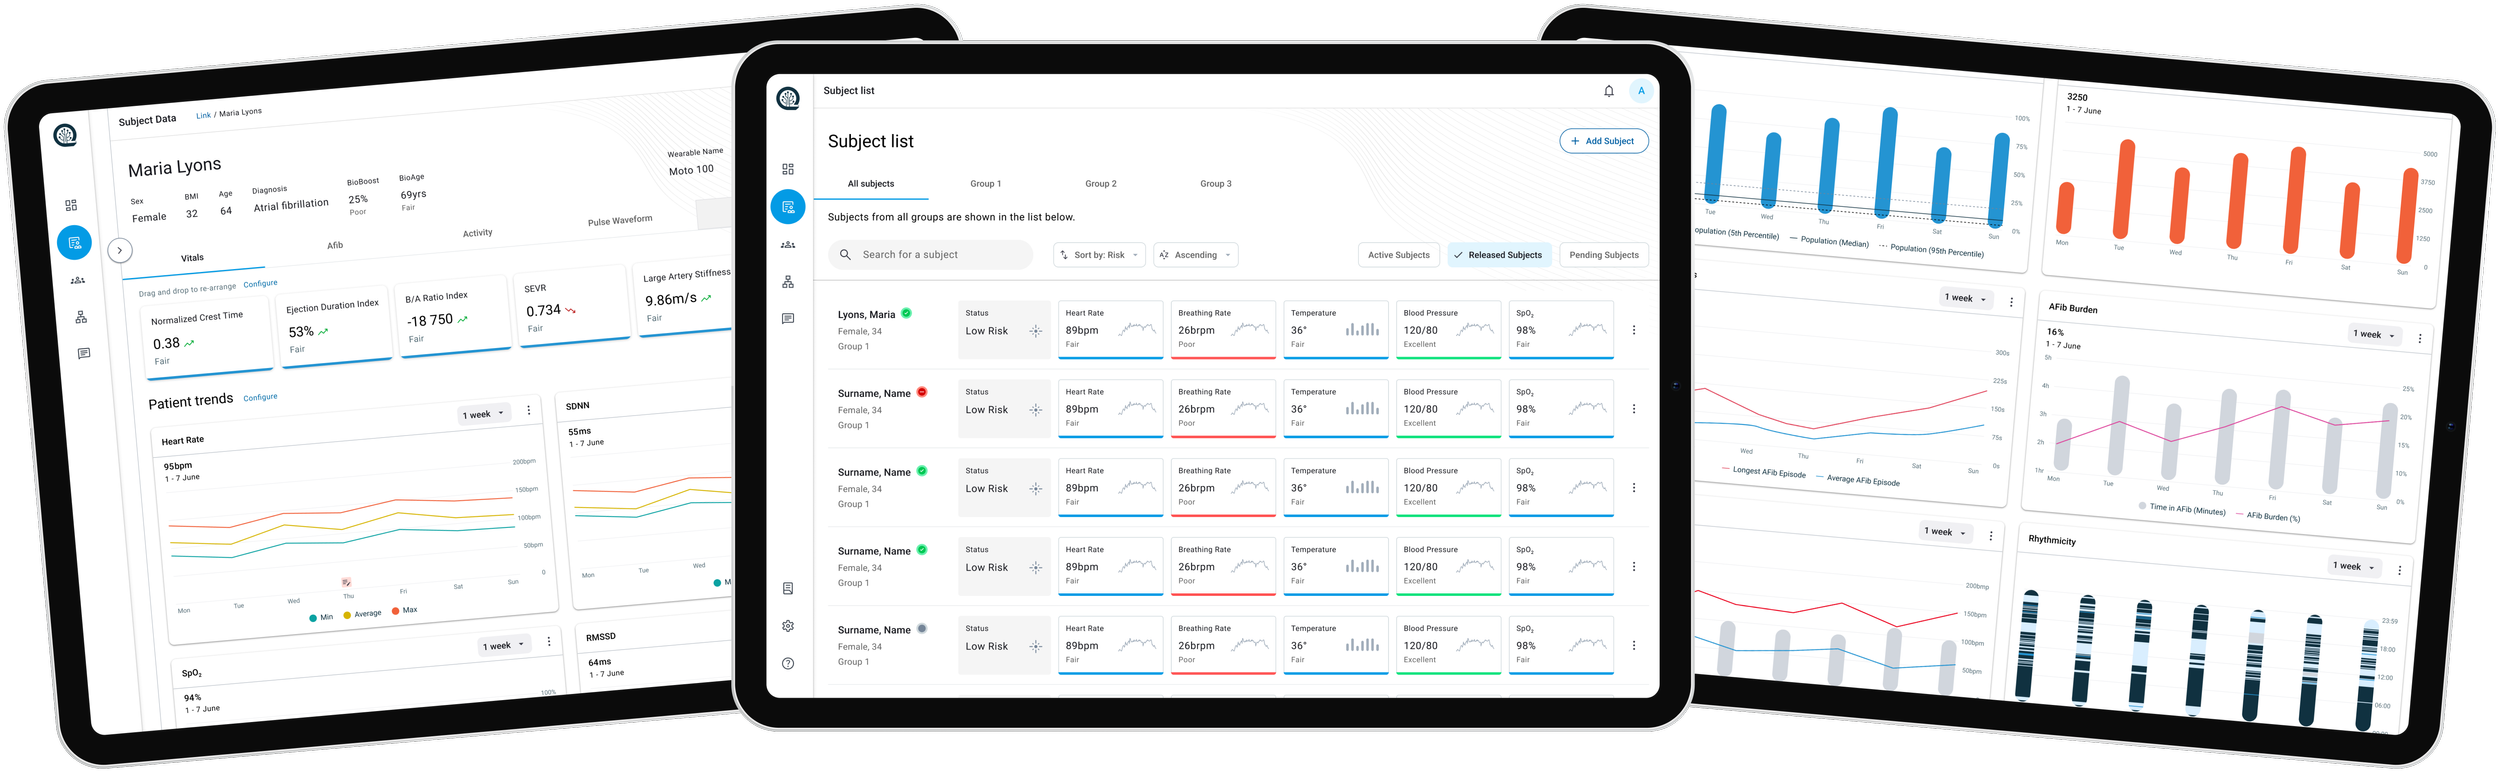
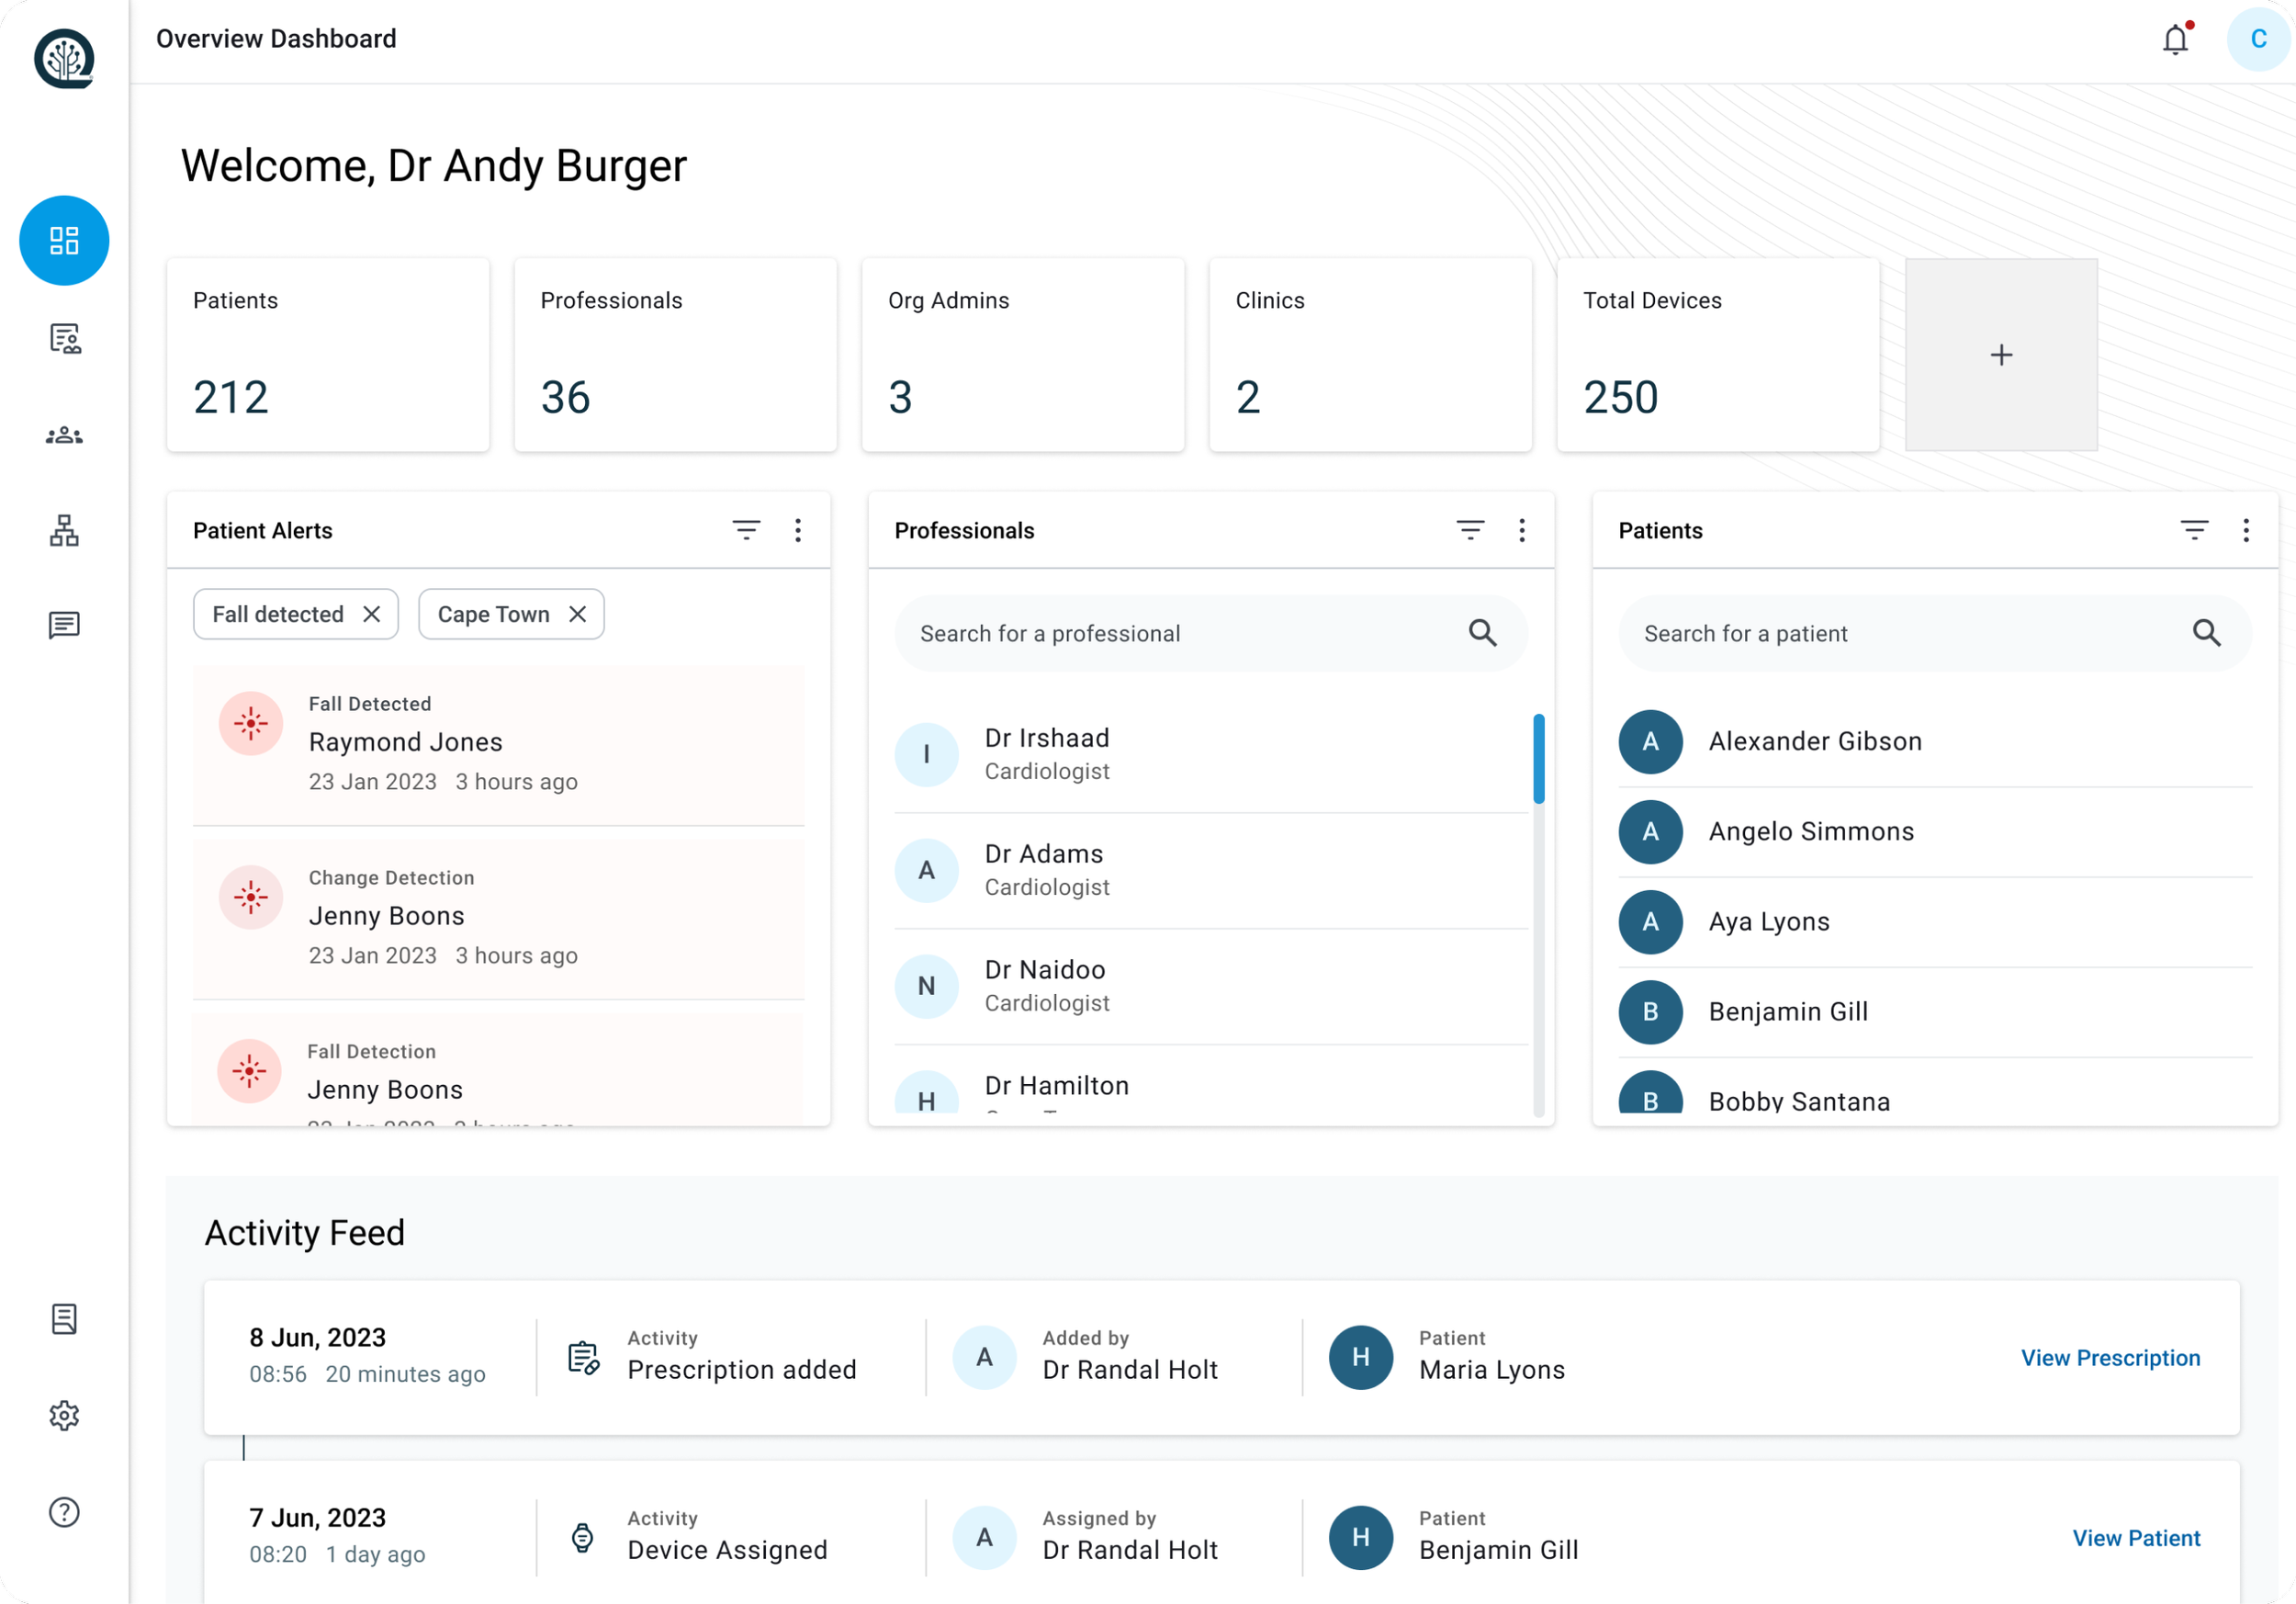
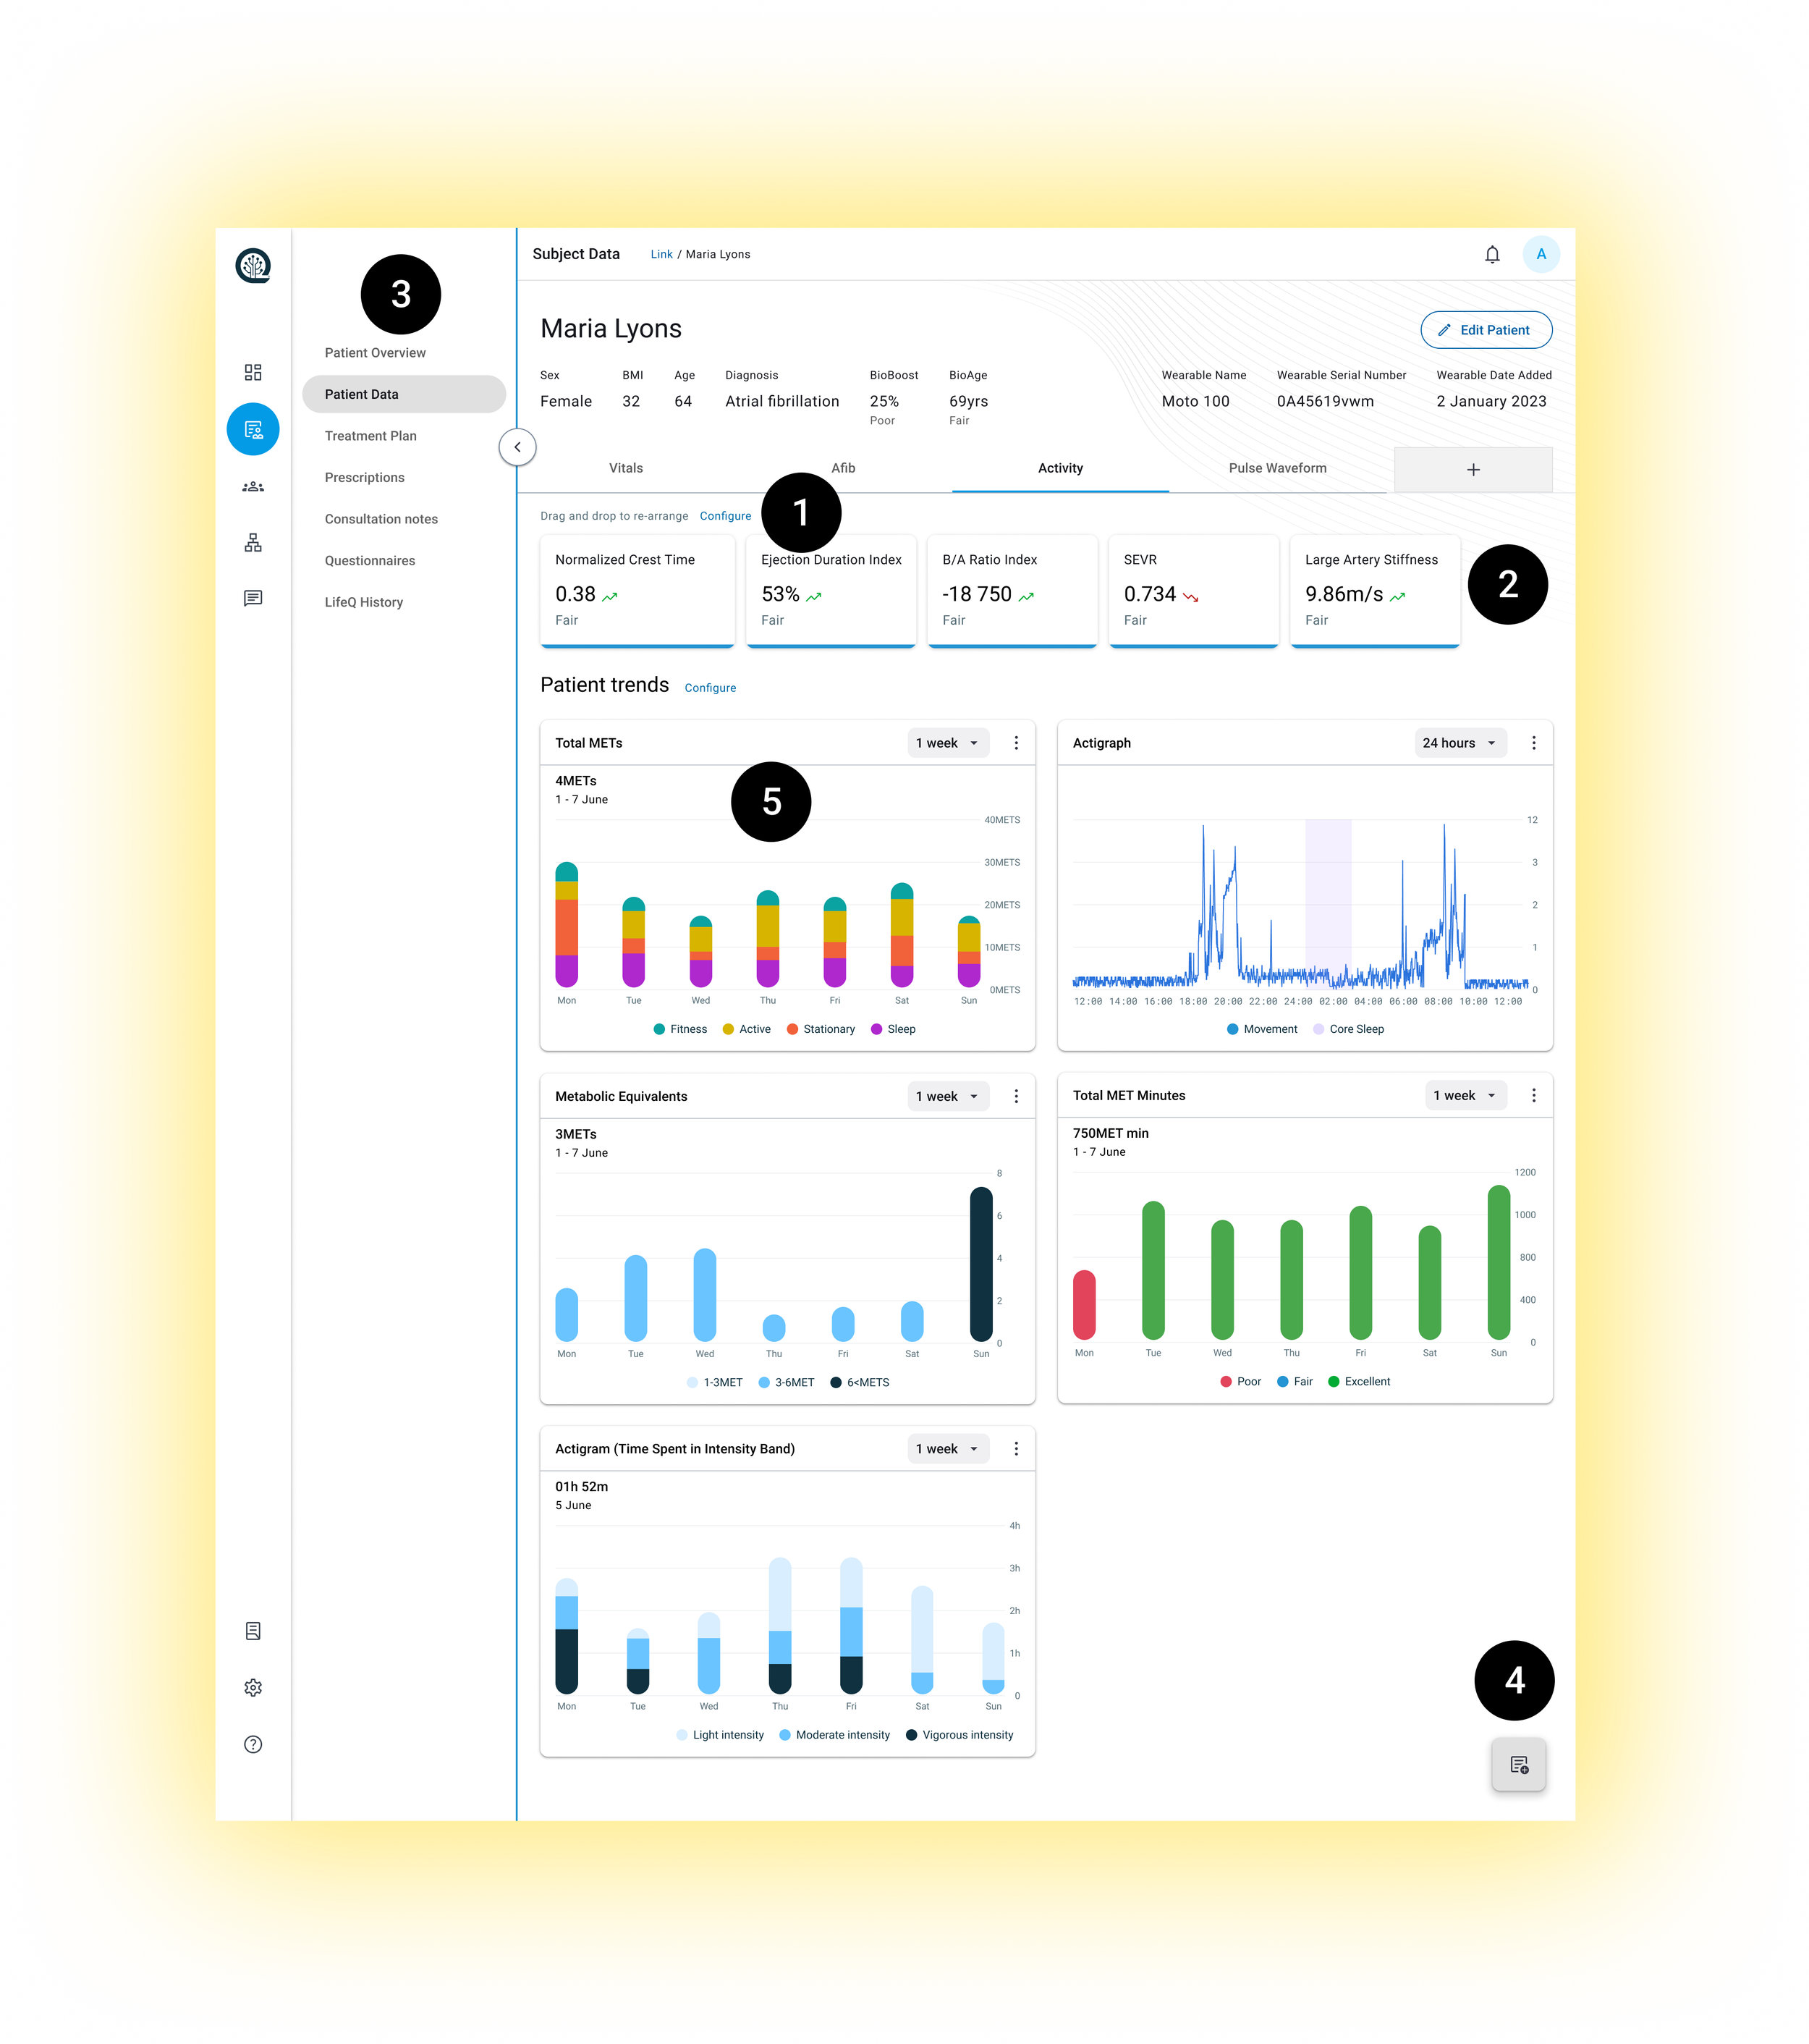
![]()
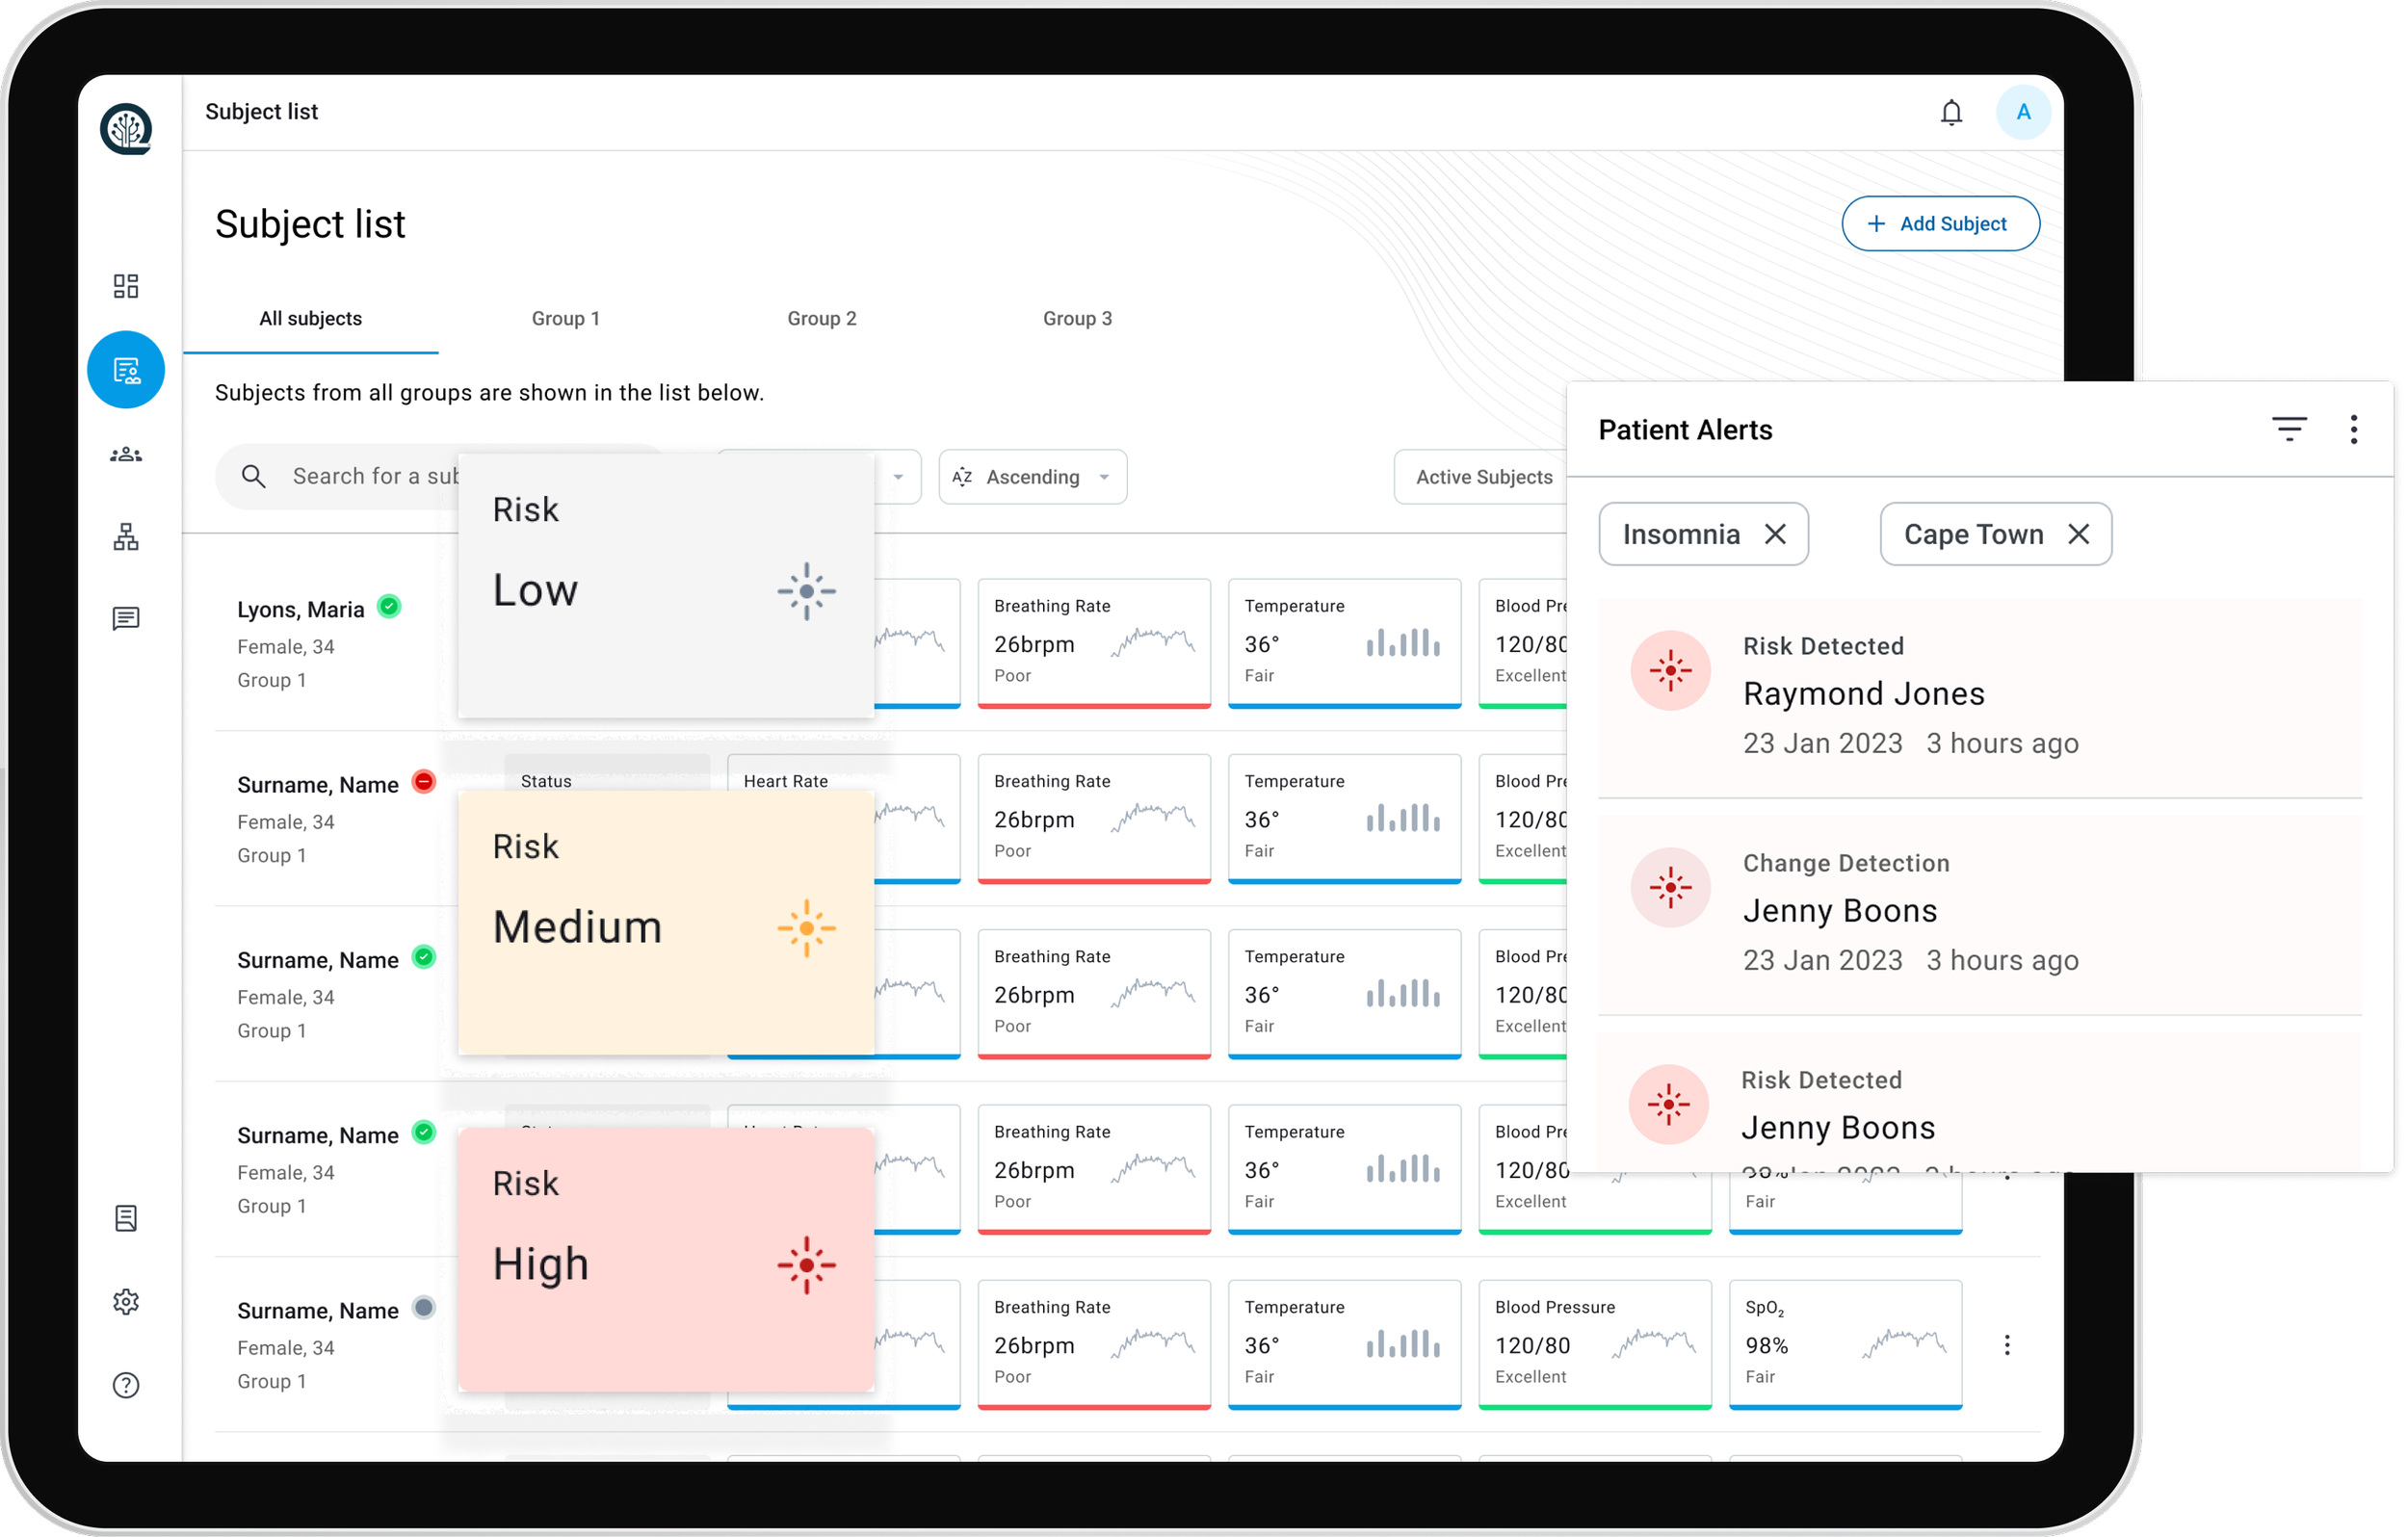
The Product
UI ROLLOUT
Core UX Strategy
-
Instead of designing static dashboards, we built:
Configurable data modules
Adjustable time ranges
Re-orderable components
Role-sensitive layouts
Each component functioned independently within a scalable system.
-
Clinical dashboards must support high-stakes decision-making. We focused on enabling clinicians to:
Interact with large datasets
Filter data subsets
Contextualize trends
Move between macro and micro analysis
-
To reduce cognitive load:
Persistent metrics bar for quick scanning
Clear subject list → patient deep dive hierarchy
Logical grouping of related metrics
Breadcrumb navigation
Consistent interaction patterns
The experience supports fast triage and deep analysis without disorientation.
-
The dashboard extended beyond data viewing.
Monitoring & Risk
Alerts and anomaly detection
Risk-level indicators
Machine learning disease detection models
Communication & Continuity
Secure chat
Activity feeds
Event annotations
Care Management
Prescription visibility
Treatment plan overview
Adherence tracking
-
Raw numbers are not insight. We prioritized:
Time-series trend visualization
Multi-metric overlays
Adjustable sample resolutions
Reference ranges and baseline comparisons
Clear anomaly indicators
This transformed complex biometric streams into clinically meaningful patterns.
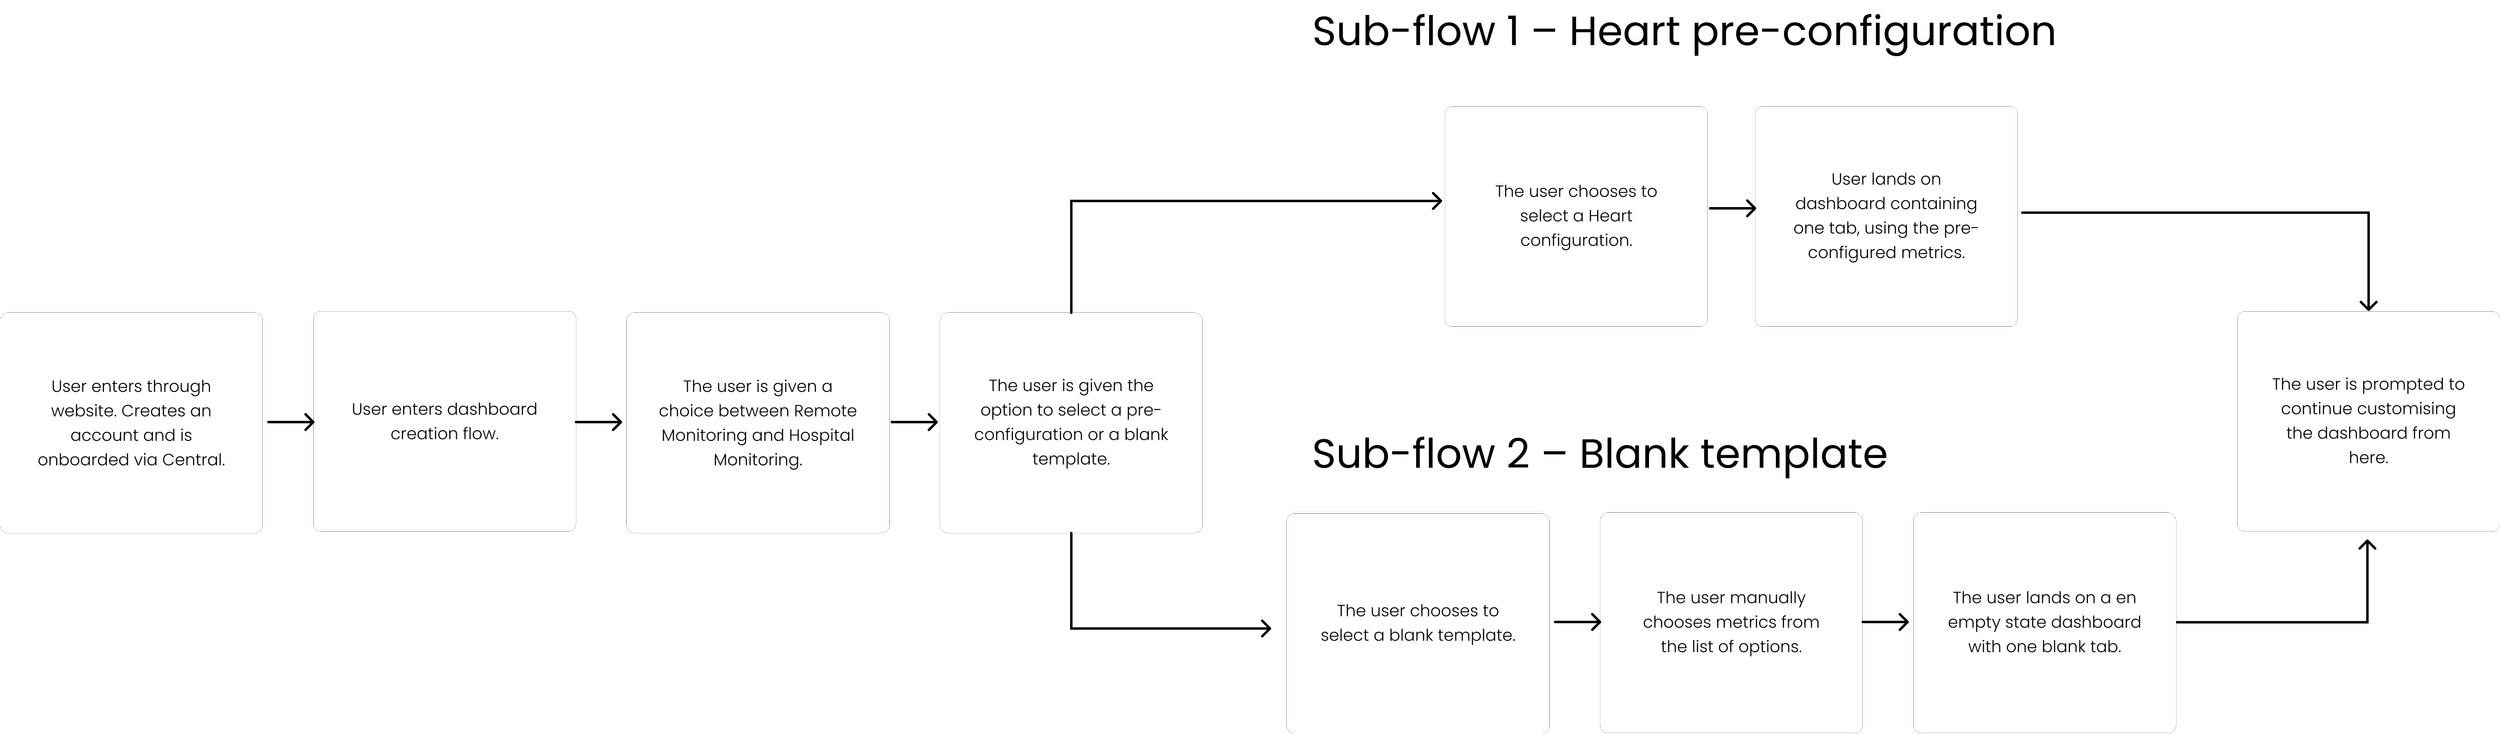
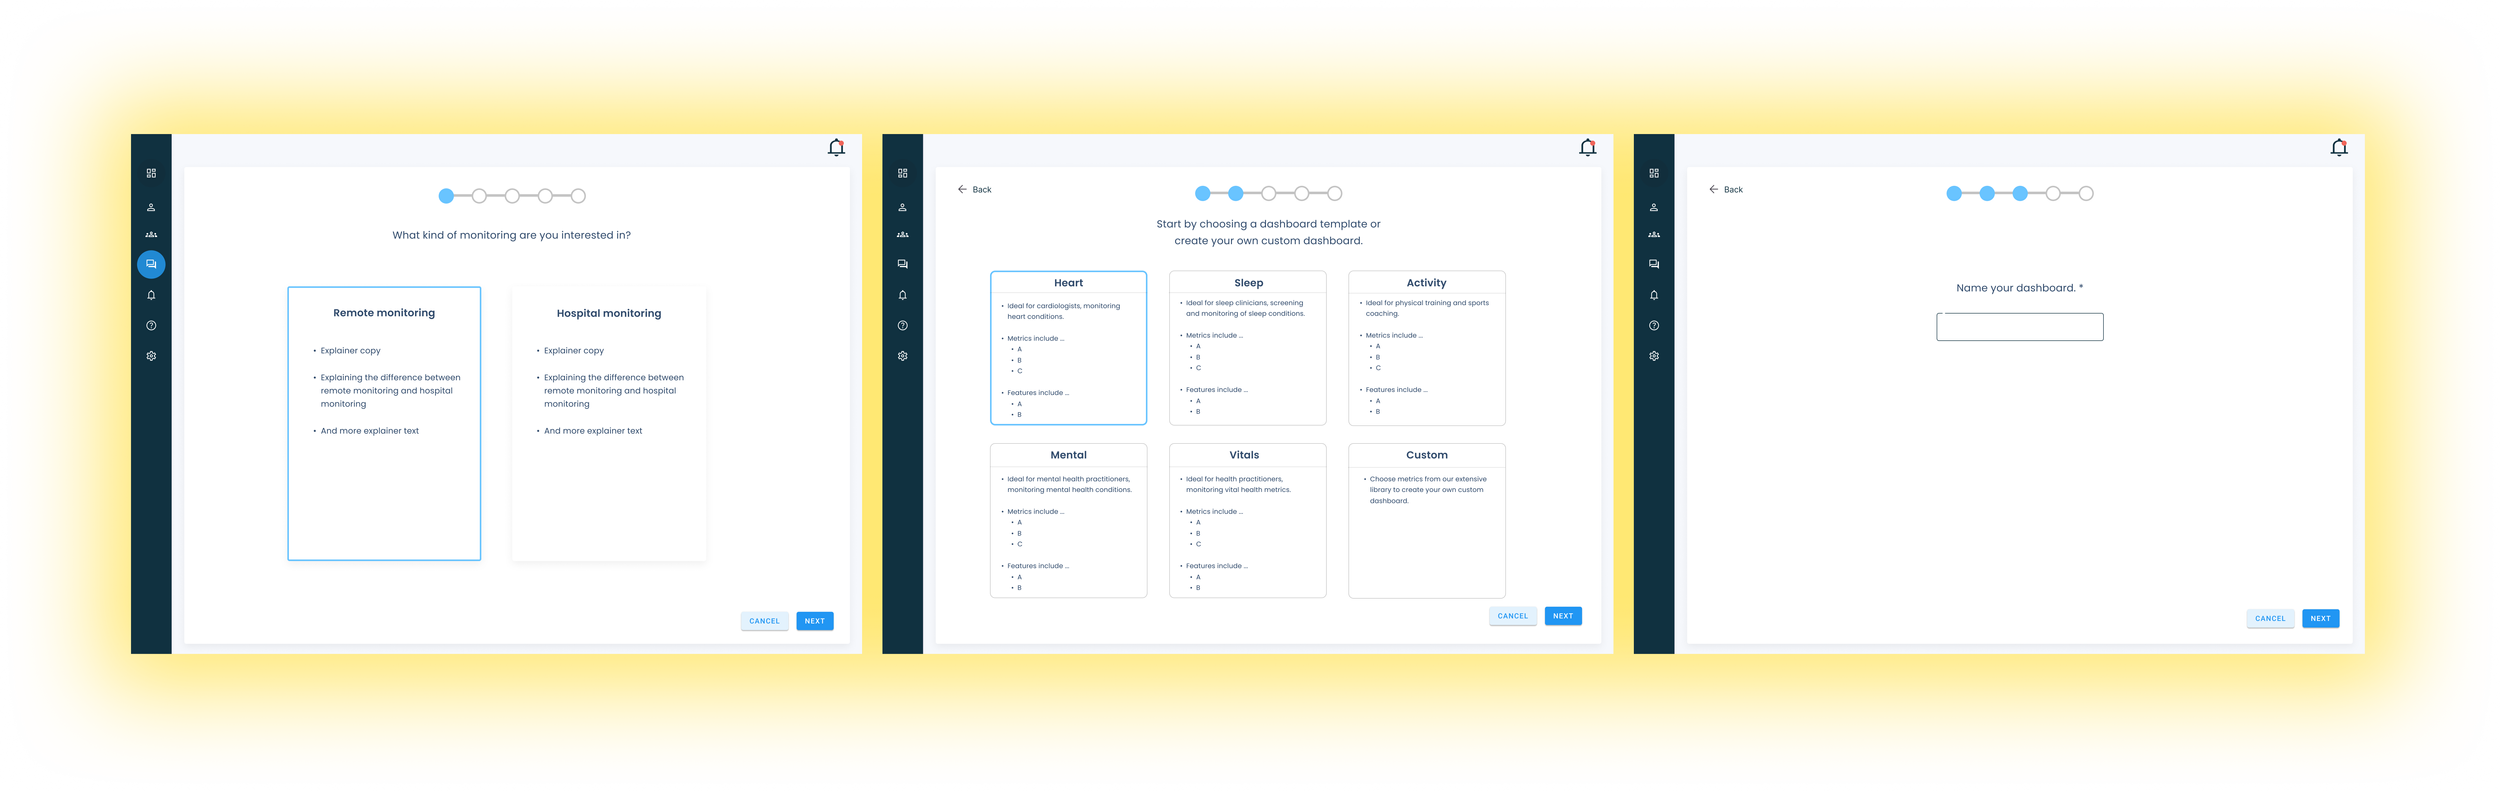
User Journey: The Configuration
The Final Product
On the surface:
A clean, controlled clinical intelligence system that:
Increased cross-vertical adoption
Reduced product fragmentation
Supported diverse clinician workflows
Strengthened trust in remote monitoring data
Enabled scalable expansion into new medical verticals
Technical Complexity, Simplified
Behind the interface:
High-frequency biometric datasets
Real-time + historical data blending
ML-driven disease detection models
Role-based access control
Performance optimization for large cohorts